I l l l l
I
x * iM
■ 9 | [
m
j
1
359
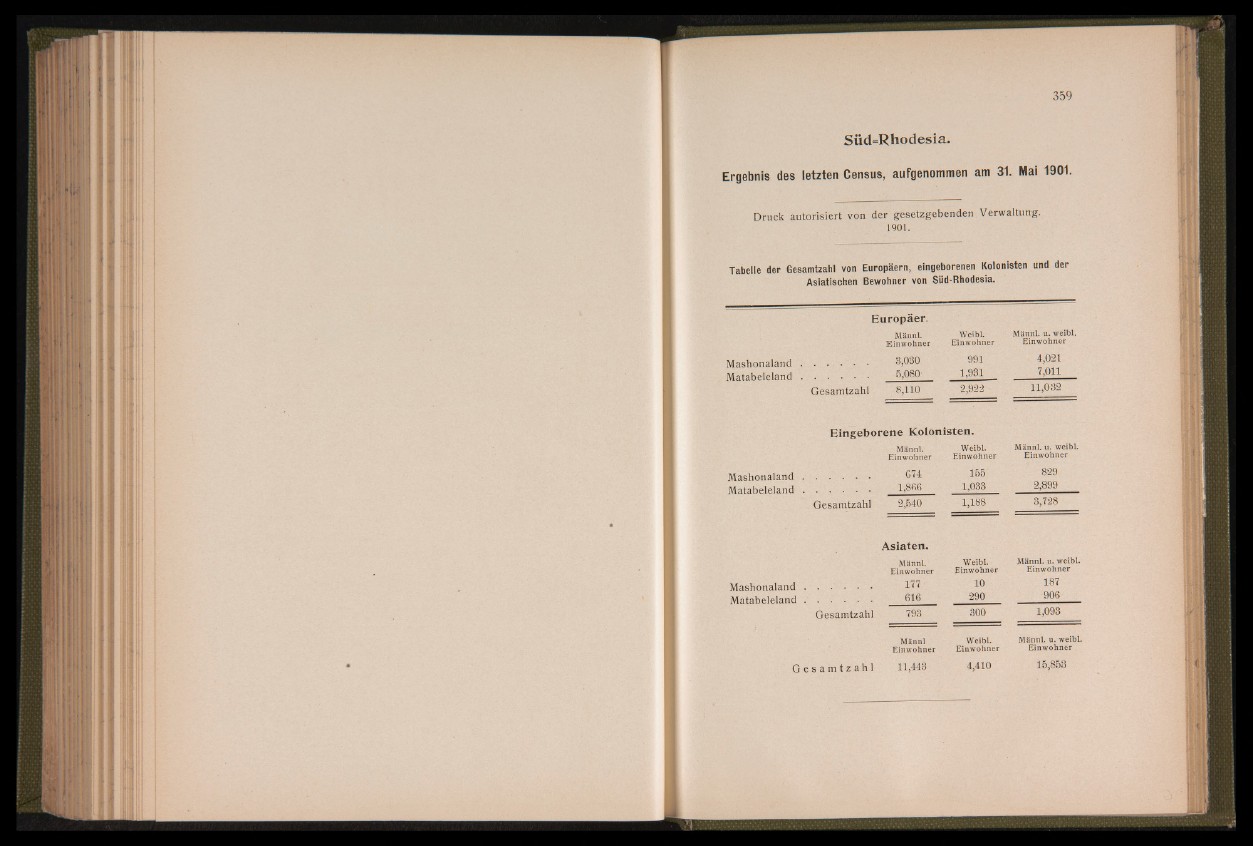
Süd=Rhodesia.
Ergebnis des letzten Census, aufgenommen am 31. Mai 1901.
Druck autorisiert von der gesetzgebenden Verwaltung.
1901.
Tabelle der Gesamtzahl von Europäern, eingeborenen Kolonisten und der
Asiatischen Bewohner von Süd-Rhodesia.
Europäer.
Weibl. Männl. u. weibl.
E inw o h n e r E inwo h n e r E inw o h n e r
Mashonaland . . . 3,030 991 4,021
Matabeleland , . . . 5,080 1,931 7,011
Gesamtzahl 8,110 2,922 11,032
Mashonaland
Matabeleland
Eingeborene Kolonisten.
Männl. Weibl. Männl. u. weibl.
E inw o h n e r E inw o h n e r E inw o h n e r
G74 155; 829
1,866 1,033 2,899
Gesamtzahl 2,540 1,188 3,728
Asiaten.
Mashonaland
Matabeleland
Männl. Weibl. Männl. u. weibl.
Einw o h n e r E inwo h n e r E inwo h n e r
177 10 187
616 290 906
Gesamtzahl 793 300 1,093
Männl Weibl. Männl. u. weibl.
E inwo h n e r E inw o h n e r E inw o h n e r
G e s a m t z a h l 11,443 4,410 15,853