route have been provided with wireless-telegraphy apparatus on the Tele-
funken system, with a wave-length of 375 meters, chiefly for the transmission
of official telegrams, but also for sending private communications.
The coast stations are at Tralleborg and Sassnitz harbour, while the ves-
selstations are the Swedish and the German boats. There were despatched
and received private telegrams during 1914, from the wireless station at
Tralleborg 50 messages with a total of 943 words, while the steamer-stations
had transmitted during the same period 1 040 telegrams with a total
of 11 568 words.
Traffic and Finances.
At the end of 1913, the capital invested in all the railways running in
Sweden was estimated in round figures to amount to a total of about 1100
million kronor, which is equivalent to about 77 000 kronor per km. This
average figure is lower than that for any other country in Europe. On
the average a kilometer of European railway costs something like 320 000
kronor, or quite four times as much as a kilometer of Swedish railway.
The cause of this remarkably low cost of construction in Sweden must, in the
first place, be sought in the fact th a t almost all our lines are still single ones,
and, generally, as being calculated for a less heavy traffic than the great mainlines
abroad, have been able to restrict themselves to a less extensive arrangement
of railway stations and to less rolling stock. A number of other circumstances
also contribute to the low cost of construction, viz., that the requisite
ground, more especially on the long stretches across Norrland, has often been
furnished free of cost by the County Councils, communes, and private persons,
and th a t the construction of lines, with the exception of the above mentioned
costly bridges, has been carried out without expensive constructive works.
T able 128. Income and Expenditure of the Swedish Railways.
Annually
Average len g th during
th e years
Kilometers1
Gross receip ts
Thousands of k ronor
E x p e n d itu re
Thousands of kronor
S ta te
railways
P riv a te
railways T o ta l
S ta te
railw ay s
P riv a te
railway s T o ta l - S ta te
railways
P riv a te
railways ) Total
1866—70 . . 1047 602 1649 6 051 3 430 9481 3592 i 721 5313
1871—75 . . 1299 1080 2379 11585 6 403 17 988 6 523 3 396 9919
1876- 80 . . 1698 3 045 4 743 15 688 13184 28872 10498 7 446 17 944
1881—85 . . 2 228 4 096 6324 19 420 18 650 38 070 11753 9 768 21521
1886—90 . . 2 513 4 915 7428 20531 21509 42040 14 082 11305 25387
1891—95 . . 2 893 5 752 8645 23 688 29217 52905 16 427 16 057 32484
1896—00. . 3 683 6 575 10 258 38354 39 407 77 761 25 234 21899 47133
1901—05 . . 4 038 7 970 12 008 49 996 49 834 99 830 37 228 30420 67 648
1906—10 . . 4 315 8944 13 259 64 902 66 009 130 911 52 519 56 473 108992
1911 . . . . 4 495 9 400 13 895 76 617 74 407 151024 58 610 60 442 119052
1912 . . . . 4 550 9 485 14035 83 204 79447 162651 62 909 63 454 126363
1913s . . . 4 692 9 570 14 262 88 693 85 222 173915 66 867 73 881 140748
1 Exclusive of some smaller lines, for which tra ffic -re turns are lacking. R 2 P ro v is io n a l
figures for th e p riv a te lines.
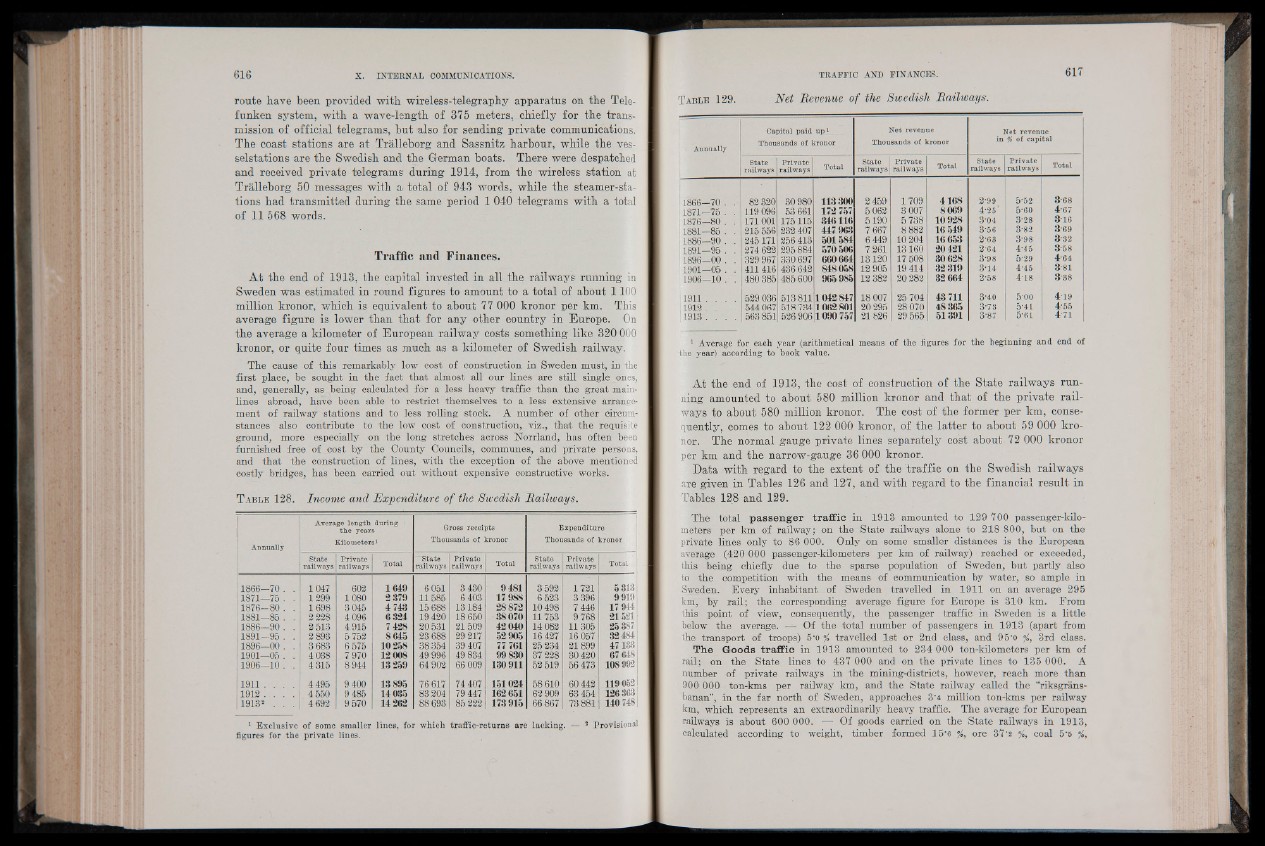
T a b l e 129. Net Revenue of the Swedish Railways.
Annually
Cap ital p a id u p 1___
Thousands o f k ronor
N e t revenue
Thousands of k ro n o r
N e t revenue
in % of c a p ita l
Sta te
railways
P riv a te
railway s T o ta l
S ta te
railways
Priv a te
railway s T o ta l
S ta te
railways
P r iv a te
railw ay s To ta l
1866-70 . . 82 320 30980 113300 2 459 1709 4168 2'99 5*52 3'68
1871-75 . 1 119 096 53 661 172 757 5062 3 007 8 069 4‘25* 5-60 4-67
1876-80 . . 171001 175115 346116 5190 5 738 10 928 3-04 3-28 3-16
1881—85 . . 215 556 232 407 447 963 7 667 8 882 16 549 3-56 3-82 369
1886—90 . . 245171 256 413 501 584 6 449 10 204 16 653 2-63 3'98 3-32
189S-95 I . 274 622 295 884 570506 7261 13160 20421 264 4-4 5 3-58
1896—00 . . 329 967 330 697 660 664 13120 17 508 30 628 3-98 5-29 4-64
1901—05 . . 411 416 436 642 848058 12 905 19 414 32 319 3-14 4'46 3-81
; 1906—10 . . 480 385 485 600 965 985 12 382 20282 32664 2-58 4-18 3-38
1911 . . . . 529 036 513 811 1042 847 18 007 25 704 43 711 3-40 500 419
11912 . . . . 544067 518 734 1062801 20 295 28 070 48365 3-73 541 4-56
¡1913 . , . 563 851 526 906 1090 757 21826 29 565 51391 3'87 5*61 4-71
1 Average for each year ..(.arithmetical means of th e figures fo r th e beginning and end of
the year) according to book value.
At the end of 1913, the cost of construction of the State railways running
amounted to about 580 million kronor and that of the private railways
to about 580 million kronor. The cost of the former per km, consequently,
comes to about 122 000 kronor, of the latter to about 59 000 kronor.
The normal gauge private lines separately cost about 72 000 kronor
per km and the narrow-gauge 36 000 kronor.
Data with regard to the extent of the traffic on the Swedish railways
are given in Tables 126 and 127, and with regard to the financial result in
Tables 128 and 129.
The total passenger traffic in 1913 amounted to 129 700 passenger-kilo-
meters per km of railway; on the-State railways alone to 218 800, but on the
private lines only to 86 000. Only on some smaller distances is the European
average (420 000 passenger-kilometers per km of railway) reached or exceeded,
this being chiefly due to the sparse population of Sweden, but partly also
to the competition with the means of Communication by water, so ample in
Sweden. Every inhabitant of Sweden travelled in 1911 on an average 295
km, by rail; the corresponding average figure for Europe is 310 km. From
this point of view, consequently, the passenger traffic in Sweden is a little
below the average. — Of the total number of passengers in 1913 (apart from
the transport of troops) 5'0 % travelled 1st or 2nd class, and 95'0 %, 3rd class.
The Goods tra ffic in 1913 amounted to 234 000 ton-kilometers per km of
rail; on the State lines to 437 000 and on the private lines to 135 000. A
number of private railways in the mining-districts, however, reach more than
900 000 ton-kms per railway km, and the State railway called the “riksgrans-
banan”, in the far north of Sweden, approaches 3'4 million ton-kms per railway
km, which represents an extraordinarily heavy traffic. The average for European
railways is about 600 000. — Of goods carried on the State railways in 1913,
calculated according to weight, timber formed 15'6 %, ore 37'2 %, coal 5-6 / ,