igs'.as
T ab le 79. Imports and Exports of Wool and Woollen Stuffs.
In quintals. '
Annually
Wool Woollen yarn,
undyed
Woollen yarn,
dyed
Woollen cloths
Imports Exports Imports Exports Imports Exports Imports Exports
'
1861—65 . . . 12 875 110 693 1118 2 4 934 36
1866—70 . . . 13 750 202 626 . 3 1322 1 5 212 246
1871—75 . . . 17 521 318 1427 4 3 420 6 15 998 460
1876—80 . . . .,13729 146 1524 2 4072 8 16 838 894
1881—85 . . . 18 429 271 3 910 3 5 435 27 22 442 1023
1886—90 . . . 21 790 286 8 950 45 . 5 752 460 23 062 1586
1891—95 . . . 24001 252 14263 53 4 528 777 25 776 2 603
1896—00 . . . 33 602 491 21468 116 5188 1076 22 399 2 385
1901—05 . . . 44 719 1244 ? 14 257 113 4 695 1212 15 424 992
1906—10 . . . 52 398 778 13 031 394 5 040 1253 16103 916
1908 . . . . . 55 877 323 10 695 366 4 788 1256 14 842 948
1909 . . . . . 51 627 948 12 971 297 4 390 1115 14 656 838
1910................ 49 749 638 17 617 308 5 881 1059 15 762 1081
191.1 . . . . . 50 674 604 15 826 273 5 549 1194 16031 1197
1912................ 66 237 618 14 502 479 5 240 1974 12 360 2 006
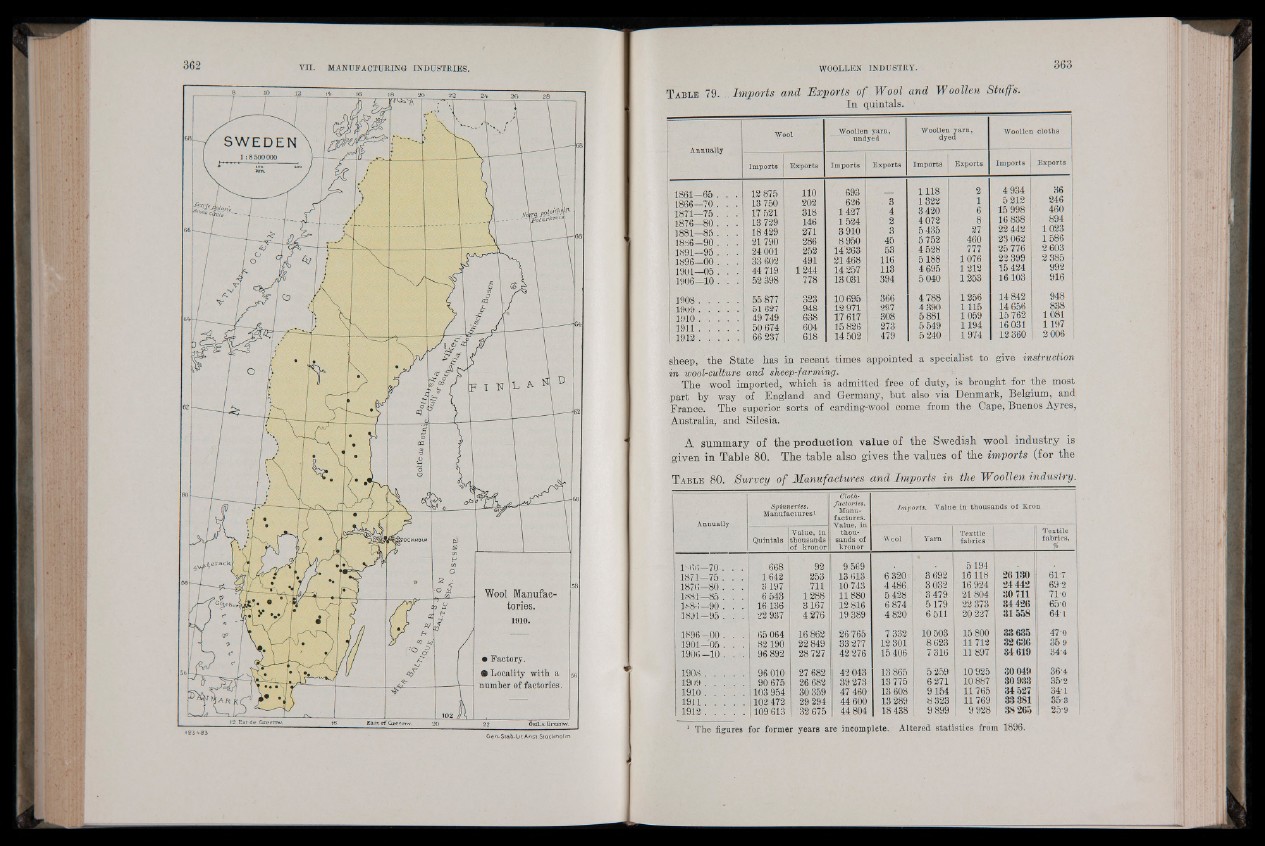
sheep, the State has in recent times appointed a specialist to give instruction
in wool-culture and sheep-farming. -
The wool imported, which is admitted free of duty, is brought for the most
part by way of England and Germany, but also via Denmark, Belgium, and
France. The superior sorts of carding-wool come from the Cape, Buenos Ayres,
Australia, and Silesia.
A. summary of the production value of the Swedish wool industry is
given in Table 80. The table also gives tbe values of the imports (for the
T able ,80. Survey of Manufactures and Imports in the Woollen industry.
Annually
Spinneries.
Manufactures!
Clothfactories.
Manufactures.
Value, in
thousands
of
kronor
Imports. Value in thousands of Kron
Quintals
Value, in
thousands
of kronor
VVcol Yarn Textile
fabrics
Textile
fabrics,
%
D m ;—70 . . . 668 92 9 569 • 5194
1871 75 . . . 1642 253 13 613 6 320 3 692 16118 26130 61-7
1876.—80 . . . 3197 .711 10 743 4 486. 3 032 16 924 24442 69 2
1881—85 . . . 6 543 1288 11880 5428 3 479 21804 30 711 710
1886—90 . . . 16 136 3167 12 816 6 874 . 5179 22 373 34426 650
1891—95 . . . 22 937 4 276 19 389 4 820 6 511 20 227 31558 64-1
1896' 00 . . . 65 064 16 862 26 765 7 332 10 503 15 800 33 635 470
1901—05 . . . 82190 22 849 33 277 12 301 8 623 11 712 32636 35 9
1906-10. . . 96 892 28 727 42 276 15 406 7 316 11897 34619 34-4
; ,1908 . . . . . 96 010 27 682 42 043 13 865 5 259 10 925 30049 364
1901)................ 90 675 26 682 39 273 13 775 6 271 10 887 30 933 352
1910 . . . . . 103 954 30 359 47 460 13 608 9154 11765 34527 34-1
I B M ................ 102 472 29 294 44 600 13 289 8 323 11769 33 381 353
1912 . . . . 1 109 613 32 675 44 804 18 438 9 899 9 928 38265 | 25-9
1 The figures for former years are incomplete. Altered statistics from 1896.