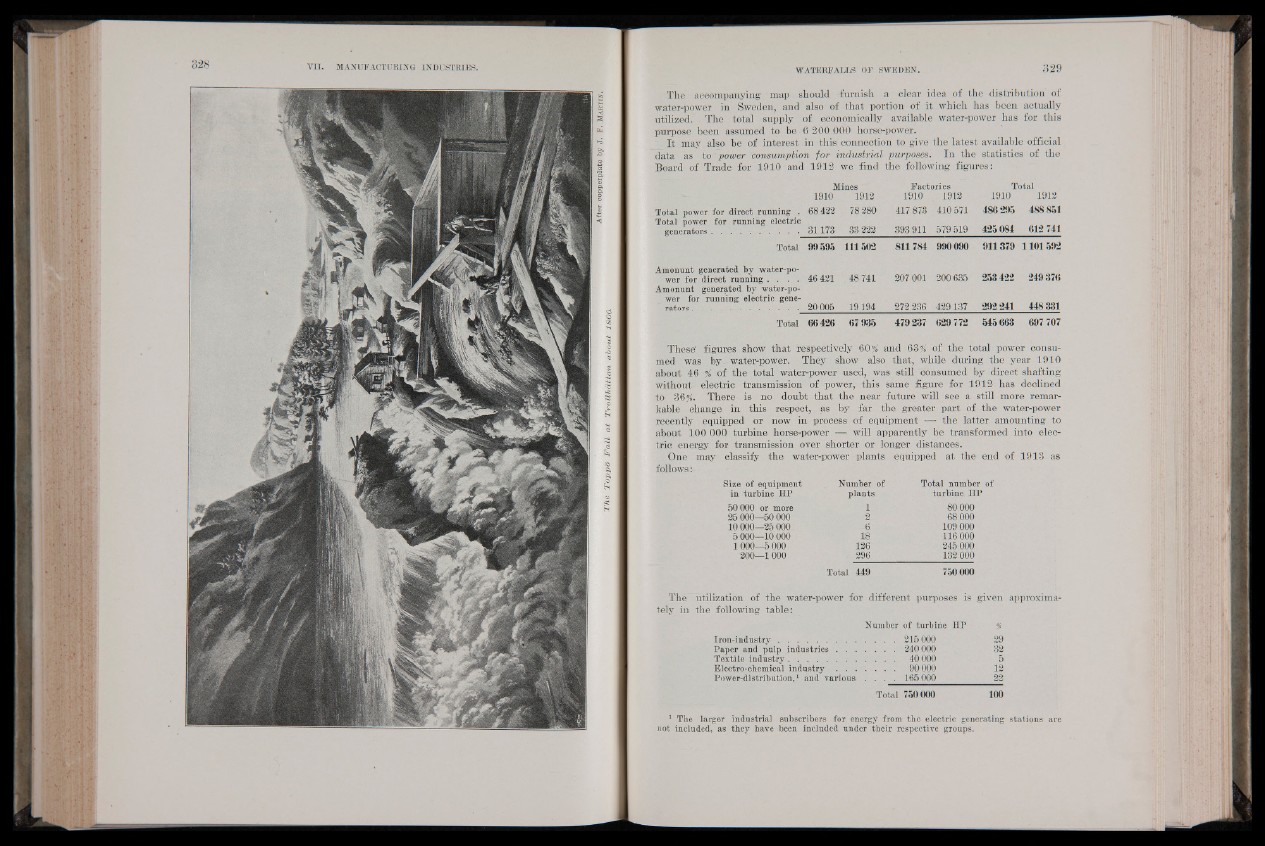
The Toppo T'ali at Trollhdttan about 1800.
The accompanying map should furnish a clear idea of the distribution of
water-power in Sweden, and also of that portion of it which has been actually
utilized. The total supply of economically available water-power has for this
purpose been assumed to be 6 20(1000 horse-power.
It may also be of interest in this connection to give the latest available official
data as to power consumption for industrial purposes. In the statistics of the
Board of Trade for 1910 and 1912 we find the following figures:
Mines Factories Total
1910 1912 1910 1912 1910 1912
Total power for direct running . 68 422 78280 417 873 410571 486 295 488 851
Total power for running electric
31173 33 222 393 911 579 519 425084 612 741
Total 99 595 111502 811784 990 090 911379 1101592
Amonunt generated by water-power
for direct running . . . . 46 421 48 741 207 001 200 635 253 422 249376
Amonunt generated by water-power
for running electric generators.
. . . . .................... .... . 20 005 19194 272 236 429 137 292 241 448331
Total 66426 67 935 479237 629772 545 663 697 707
These figures show that respectively 60^ and of the total power consumed
was by water-power. They show also that, while during the year 1910
about 46 % of the total water-power used, was still consumed by direct shafting
without electric transmission of power, this same figure for 1912 has declined
to 36%. There- is no doubt that the near future will see a still more remarkable
change in this respect, as by far the greater part of the water-power
recently equipped or now in process of equipment —- the latter amounting to
about 100 000 turbine horse-power ^ will apparently be transformed into electric
energy for transmission over shorter or longer distances.
One may classify the water-power plants equipped at the end of 1913 as
follows:
Size of equipment
in turbine HP
50 000 or more
25 000—50 000
10 000—25 000
5000—10 000
1000—5 000
200—1000
Number of
plants
1
2
-6
18
126
■ 296
Total number of
turbine HP
80000
68 000
109 000
116 000
245 000
132 000
Total 449 750000
Thé utilization of the water-power for different purposes is given approximately
in the following tablé :
Number of turbine HP %
Iron-industry................... . 215 000
Paper and pulp in d u strie s........................ Textile industry........................................... Electro-chemical i n d u s t r y ........................ 90 000
Power-distribution,1 and various . .
29
240 000
32
40 000
5
12
165 000 22
750 000 100
1 The larger industrial subscribers for energy from the electric generating stations are
not included, as they have been included under their respective groups.