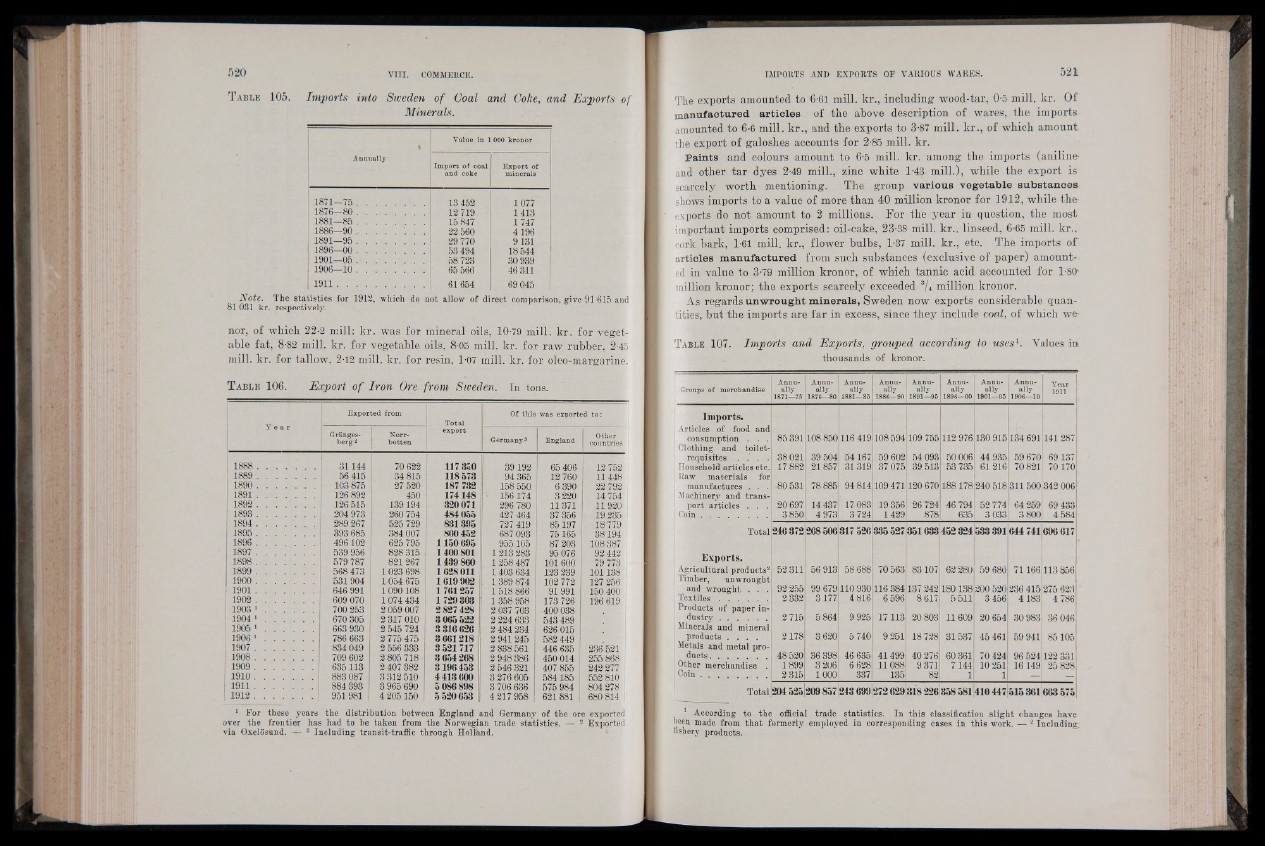
T able 105. Imports into Sweden of Coal and Coke, and Exports of
Minerals.
%
Annually
Value in !
Import of coal
and coke
000 kronor
Export of minerals
1871—75 ............................ 13 452 1077
1876-80 ........................... 12 719 1413
1881—85 ............................ 15 847 1747
1886—90 .................... 22 560 4196
1891—95 ............................ 29 770 9131
1896—00 ........................... 53494 18 544
1901—05 ............................ 58 723 30 939
1906—10 ............................ 65 566 46 311
1911................................... 61 654 69 045
Note. The statistics for 1912, which do not allow of direct comparison, give 91 619 and
81031 kr. respectively.
nor, of which 22-2 mill: kr. was for mineral oils, 10-79 mill. kr. for vegetable
fat, 8-82 mill. kr. for vegetable oils, 8-05 mill. kr. for raw rubber, 2-45
mill. kr. for tallow, 2-12 mill. kr. for resin, 1-07 mill. kr. for oleo-margarine.
T able 106. Export of Iron Ore from Sweden. In tons.
Y e a r
Exported from
Total
export
o f this was exported to :
Gränges-
berg 2
Norrbotten
Germany 8 England Other
coüntries i
1888 31144 70 622 117 350 39192 65 406 12 752 ¡
1889 ........................ 56 415 34 815 118573 94 365 12 760 11 448
1890 ........................ 103 875 27 520 187 732 158 550 6 390 22 792
1891........................ 126 892 450 174148 ■ 156174 3 220 14 754
1892 ................... . 126 515 139 194 320 071 296 780 11371 11920
1893........................ 204 973 260 754 484 055 427 464 37 356 19 235
1894 ........................ 289 267 525 729 831 395 727 419 85197 18779
1895 ........................ 393 685 384 007 800 452 687 093 75165 38194 !
1896 ........................ 496102 625 795 1150 695 955 105 87203 108387
1897........................ 539 956 828 315- 1400 801 1213 283 95076 92 442
1898 ........................ 579 787 821267 1439 860 1258 487 101 600 79 773 {
1899 ........................ 568 473 1023 698 1628 011 1 403 634 123 239 101138
1900........................ 531904 1054 675 1619902 . 1389 874 102 772 127 256
I 1901 ........................ 646 991 1 090108 1 761 257 1 518 866 91991 ■150 400 i
1902 ........................ 609 070 1074 434 1729303 1358 958 173 726 ; 196 619
1903 1 .................... 700 253 2 059007 2 827 428 2 037 703 400 038
1904 1 .................... 670 305 2 317 010 3 065 522 2 224 633 543 489
1905 1 .................... 663 930 2 545 724 3316626 2 484 234 626 015
1906 1 .................... 786 663 2 775 475 3661218 2 941 245 582 449
1907 ........................ 834 049 2 556 333 3 521717 2 838 561 446 635 236 521
1908 ........................ 709 602 2 805 718 3 654268 2 948 386 450014 255 868
1909 ........................ 635113 2 407 382 3196 453 2 546 321 407 855 242 277 i
1910........................ 883 087 3312 510 4413600 3 276 605 584185 552 810
1911........................ 884 393 3 965 690 5086 898 3 706 636 575 984 804 278
1912........................ 951981 4 205150 5 520 653 4 217 958 621881 680 814
1 For these years the distribution between England and Germany of the ore exported
over the frontier has had to be taken from the Norwegian trade statistics. 8 2 Exported
via Oxelüsund. — 8 Including transit-traffic through Holland.
The exports amounted to 6:61 mill, kr., including wood-tar, 0-5 mill. kr. Of
manufactured ar tic le s of the above description of wares, the imports
amounted to 6-6 mill, kr., and the exports to 3-87 mill, kr., of which amount
the export of galoshes accounts for 2-85 mill. kr.
Paints and colours amount to 6-5 mill. kr. among the imports (aniline-
and other tar dyes 2-49 mill., zinc white 1-43 mill.), while the export is
scarcely worth mentioning. The group various v eg e tab le substances
shows imports to a value of more than 40 million kronor for 1912, while the-
exports do not amount to 2 millions. For the year in question, the most
important imports comprised: oil-cake, 23-38 mill. kr.. linseed, 6-65 mill, kr.,
cork bark, 1-61 mill, kr., flower bulbs, 1-37 mill, kr., etc. The imports of'
articles manufactured from such substances (exclusive of paper) amounted
in value to 3-79 million kronor, of which tannic acid accounted for 1-80-
million kronor; the exports scarcely exceeded 3\i million kronor.
As regards unwrought minerals, Sweden now exports considerable quantities,
but the imports are far in excess, since they include coal, of which we-
Table 107. Imports and Exports, grouped according to uses1. Values in
thousands of kronor.
Groups of merchandise
Annually
1871—75
Annually
1876—80
Annually
1881—85
Annually
1886-90
Annually
1891—95
Annually
1896—00
Annually
1901—05
Annually
1906-Lio
Year
1911
Imports.
Articles o f food and
consumption . . . 85 391 108 850 116 419 108594 109 755 112 976 130 915 134 691 141 287
Clothing and toiletrequisites
. . . . 38 021 39 504 54167 59 602 54093 50 006 44 935 59 670 69137:
Household articles etc. 17 882 21857 31319 37075 39 513 53 735 61216 70 821 70170
Raw materials for
manufactures . . . 80 531 78 885 94 814 109 471 120 670 188178 240 518 311500 342 006
Machinery and transport
articles . . . 20 697 14 437 17-083 19 356 26 724 46 794 52 774 64 259 69 433
Coin........................... 3 850 4 973 3 724 1429 878 635 3 033 3 800 4 584
Total 246372 268 506 317 526 335527 351633 452 324 533 391 644 741 696617
Exports.
Agricultural products2 52 311 56 913 58 688 70 563 83107 62 280 59 680 71166 113 856
Timber, nnwronght
and wrought . . . 92 255 99679 110 930 116 384 137 242 180138 200 520 236 415 275 623
Textiles.................... 2 332 3177 4 816 6 596 8 617 5 511 3 456 4183 4 786
Products of paper industry
................... 2 715 5864 9 925 17113 20 803 11609 20 654 30 983 36 046
Minerals and mineral
products . . '. . . 2178 3620 5 740 9 251 18 728 31537 45 461 59 941 85105
Metals and metal products.
. . . . . . . 48 520 36 398 46 635 41499 40276 60 361 70 424 96 524 122 331
Other merchandise . 1899 3 206 6 628 11088 9 371 7144 10 251 16149 25 828
Coin . . . 2 315 1000 337 135 782 1 1 — ■
Total 204 525 209 857 243 699 272 629 318226 358 581 410 447 515 361 663 575
1 According to the official trade statistics. In this classification slight changes have
been made from that formerly employed in corresponding cases in this work. — 2 Including;
fishery products.