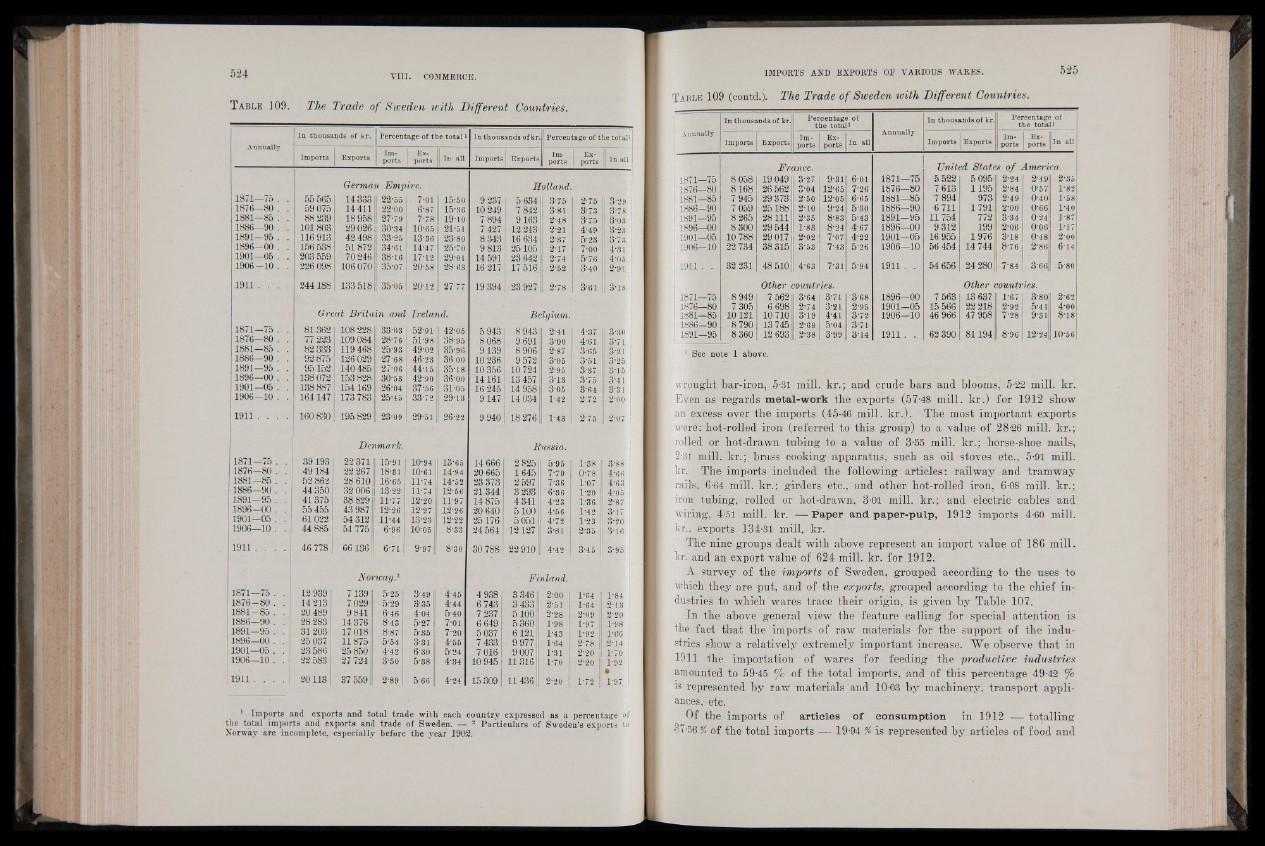
T able 109. The Trade of Sweden with Different Countries.
Annually
I d thousands of kr. Percentage of the total In thousands ofkr Percentage of the totali
Imports Exports Imports,
Exports
In all Imports Exports Imports
Exports
In all
German Empire. Holland
1871—-75 . .
1876—80 . .
1881—85 . .
1886—90 . .
1891—95 . .
1896-00 . .
1901—05 . .
1906-10. .
55 565
59 075
88 239
101 803
116 913
156 538
203 559
226 098
14 333
14 411
18 958
29026
42 498
51872
70 246
106 070
22-55
22-00
27-79
30-34
33-25
34-61
38*16
35-07
7*01
6*87
7-78
10-65
13-36
14-47
17-12
20-58
•'45-50
15-36
1 19-10
I 21-51
23-80
25-70
29-01
28-63
9 237
10 249
7 894
7 427
8 343
9 813
14 591
16 217
5 634
7 842
9163
12 243
16 634
25105
23 642
17 516.
3*75
3*81
2'48
2-21
2-37
2-17
2-74
2-52
2'75
3-73
3*75
4-49
5-23
7-00
5*76
3*40
I 3-29
3*78
3-03
3-23
3-73
4-31
4-05
2-91
1911 . . . . 244188 1 133 518 35-05 20-12 27-77 19 394 23 927 2-78 3*61 3-18
Great Britain ani Ireland. Belgium.
1871—75 . .
1876—80 . .
1881—85 . .
1886-90 . .
1891—95 . .
1896—00 . .
1901-05 . .
1906—10 . .
81362
77 223
82 333
92 875
95152
138 072
138 887
164147
I 108 228
109 084
119 468
1 126 029
140 485
153828
154169
173 783
33-03
28-76
25-93
27-68
27-06
30-53
26-04
25-45
52-91
51-98
49-02
46-23
44-15
42-90
37*56
33*72
42-05
38-95
35-96
36 00
35-18
36*00
31*05
29-13
5943
8 068
9139
10 236
10 356
14161
16 245
9147
8 943
9 691
8906
9 572
10 724
13 457
14 958
14 034
2-41
3-00
2-87
3*05
2-95
3-13
305
1-42
4*37
4-61
3*65
3*51
3-37
3-75
3-64
2*72
3-30 :
3-71
3-21
3-25 !
3*15
3-41 :
3-31 j
2-00 [
1911 . . . . 160 830 195829 23-09 29-51 26-22 9 940 18 276 1-43 2-75 2-07
Denmark. Russia.
1871—75 . .
1876-80 . .
1881—85 . .
1886—90 . .
1891-95 . .
1896 - 0 0 . .
1901—05 . .
1906—10 . .
■ 39193
49 184
52 862
44 350
41375
55 455
61022
44 885
22 371
22 267
. 28 610
32 006
38 829
43 987
54 312
51 775
15-91
18-31
16-65
13-22
11-77
.12-26
11-44
6-96
10-94
10-61
11-74
11-74
12-20
12-27
13-23
10-05
13"65
14-94
14*52
12-56
11-97
12-26
12-22
8-33
14 666
20 665
23 373
21344
14 875
20 640
25 176
24 564
2825
1 645
- 2 597
3 293
4 341
5100
5 051
12127
5’95
7-70
7-36
6-36
4-23
4-56
4-72
3-81 ■
1-38
0-78
1-07
Sl-20
1-36
1-42
1-23
2*35
3-88 I
4-66
4-63
4-05
2-87
3*17
3*20
-3*16
1911 . . . . 46 778 661361 6-71 9-97 1 . 8-30 30 788 22 910 4-42 3*45 1 3*95
Notway? Finland.
1871—75 . .
1876 - 8 0 .' .
1881-85 . .
1886—90 . .
1891—95 . .
1896—00 . .■
1901—05 . .
1906—10 . .
12 939 I
14 213
20 489
28 283
31203
25 037
23 586
22 583
7139
7 029
9 841
14 376
17018
11875
25 850
27 724
5-25
5-29
6-46
8-43
8-87
5-54
4-42
3*50
3-49 I
3-35
4-04 1
5-27 y
5-35 I
3-31
6-30
5-38
4-45
4-44
5-40
7-01
7-20
4-55
5'24
4-34
4 938
6 743
7 237
6 649
5 037
7 433
7 016
10 945 |
3 346
3 433
5100
5 360
6121
9 977
9 007
11316
2-00 I
2-61 J
2-28
1-98
1-43
1-64
1-31
1-70'
1-34 I
1*64
2-09-
1-97
1-92
2" 1 8 1
2-20
2-20
1*84
2*13
2*20
11**(9?86P1
•2*14
1*70
1*92
1911 . . . . 20113 37 559 2*89 5;66 1 4;24 15 309 | 11 436 2-20 1 1-72 1
•
1*97 1
1 Imports and exports and total trade with each country expressed as a percentage of
the total imports and exports and trade of Sweden. — 2 Particulars of Sweden’s exports to
Norway are incomplete, especially before the year 1902.
Table 109 (contd.j. The Trade o f Sweden with Different Countries.
Annually
In thousands of kr. Percentage of
the total i
Annually
In thousands of kr. Percentage of
the totaH
Imports Exports Im ports
Exports
In all Imports Exports Imports
Exports
In all
France. United States o f America.
1871-75 8 058 19 049 3*27 9-31 6*01 1871—75 5 522 5095 2-24 2-49 2-36
1876—80 8168 26 562 3*04 12-65 7*26 1876-80 7 613 1195 2-84 0-57 1-82
1881—85 7 945 29 373 2-50 12*05 6*65 1881—85 7 894 973 2-49 0*40 1-58
1886-90 7 059 25188 2-10 9-24 5*30 1886—90 6 711 1791 2*00 0-66 1-40
1891—95 8 265 28111 2-35 8-83 5*43 1891—95 11754 772 3-34 0-24 1-87
1S96—00 8 300 29 544 1-83 8-24 4*67 1896—00 9 312 199 2-06 006 1-17
1901—05 10 788 29 017 2-02 7-07 4*22 1901—05 16 955 1976 3-18 0-48 2-00
1906—10 22 734 38 315 3-53 743 5*26 1906-J.O 56 454 14 744 8-76 2-86 614
1911 . .. 32 231. 48 510 4-63 7-31 5*94 1911 . . 54 656 24 280 7-84 3'66 5-80
Other countries. Other countries.
1871—75 8949 7 562 3-64 £*71 ’3*68 1896-00 7 563 13 637 1-67 3-80 2-62
1876—80 7 305 6 698 2-74 3*21 2*95 1901—05 15 566 22 218 2-92 5*41 4-001
1881—85 10 121 10 710 3-19 4*41 3*72 1906-10 46 966 47 958 7*28 9-31 8-18
1886-90 8 790 13 745 2-63 5*04 3*71
1891—95 8360 12 693 2-38 3*99 3*14 1911 . . 62 390 81194 8-96 12-24 J0*56|
1 See note 1 above.
wrought bar-iron, 5-31 mill, kr.; and crude bars and blooms, 5-22 mill. kr.
Even as regards metal-worb the exports (57-48 mill, kr.) for 1912 show
an excess over the imports (45-46 mill. kr.). The most important exports
were: hot-rolled iron (referred to this group) to a value of 28-26 mill, kr.;
rolled or hot-drawn tubing to a value of 3-55 mill, kr.; horse-shoe nails,
2-31! mill, kr.; brass cooking apparatus, such as oil stoves etc., 5-91 mill,
kr. The imports included the following articles: railway and tramway
rails, 6-64 mill, kr.; girders etc., and other hot-rolled iron, 6-08 mill, kr.;
iron tubing, rolled or hot-drawn, 3-01 mill, kr.; and electric cables and
wiring, 4-51 mill. kr. — Paper and paper-pulp, 1912 imports 4-60 mill,
kr., exports 134-31 mill. kr.
The nine groups dealt with above represent an import value of 186 mill,
kr. and an export value of 624 mill. kr. for 1912.
A survey of the imports of Sweden, grouped according to the uses to
which they are put, and of the exports, grouped according to the chief industries
to which wares trace their origin, is given by Table 107.
In the above general view the feature calling for special attention is
the fact that the imports of raw materials for the support of the industries
show a relatively extremely important increase. We observe that in
1911 the importation of wares for feeding the productive industries
amounted to 59-45 % of the total imports, and of this percentage 49-42 °fo
is represented by raw materials and 10-03 by machinery, transport appliances,
etc.
Of the imports of articles o f consumption in 1912 — totalling
37-56 % of the total imports — 19-94 % is represented by articles of food and