phorus-content rarely exceeding 0'08 %. As to the proportion of sulphur, 87'7 /
of the prime ore produced in 1913 contained less than 0'06 % and only 3’1 %
more than 0"io %.
In 1913 were extracted altogether 10 989 005 tons of ore and waste, out
of which were obtained 7 475 571 tons of picked ore and concentrate, making
on an average 68-0 Jo of the rock hoisted. The average quantity of iron
ore relatively the rock hoisted for the whole of Sweden during the last 20
years has fluctuated between 54-5 % in 1893 and 71-1 Jo in 1911, and since
1903 has exceeded 62 %. This may be to a great extent accounted for
by the big contribution to the output of iron ore made during these years
by the Norrbotten mines, in which the quantity of ore is for the most
part high. In the mines of Central Sweden the quantity of iron ore
fluctuates as a rule, between 50 and 60 % of the rock hoisted.
The concentration of iron ore was carried on in 1913 at -38 concentration
works, in which out of 1 537 664 tons of ferriferous materials 381190
tons of concentrates were produced. The following table summaries will
serve to give some notion of the quality of the crude ore and of the concentrate
produced from it.
Average Iron-content Crude Ore
tons
Concentrate
tons
less than 30 percent............................
from 30 to 40 percent........................
> 40 » 50 » ........................
> 50 > 60 > ........................
» 60 » 70 » ........................
70 percent and over............................
. . . . 220691
. . . . 911545
. . . . 386569
. . . . 18859 2 711
609 482
45 783
Total 1537 664 657 976
Average Phosphorus-content Concentrate
tons
less than O'oos p e rc en t........................
from O'oos to 0*oio percent . . .
» 0*010 » 0*020 » . . .
> 0*020 » 0*080 » . . .
» 0*080 » 0*050 > . . .
> 0*050 » 0*100 » . . .
0*ioo percent and o v e r ........................
181141
220 687
81575
4807
87 357
18371
64 038
Total 657 976
A* verage sutl pih ur-con.t en.t Concentrate
less than O'oos p e rcen t........................................................... 30109
from O’oos to 0*oio p e r c e n t............................................ 67 457
> 0*oio * 0*o2o > 68 561
0*020 » O'oso » . 65 082
> O’oso * O’oso > 8 080
» O'oso » 0*ioo > 139 844
0*ioo percent and over . . 238 765
Sulphur-content not g iv e n 40 078
Total 657 976
The number of workmen employed in 1913 in Swedish iron mines and in
concentration and briquetting works for iron ore was 1 1 811, out of which
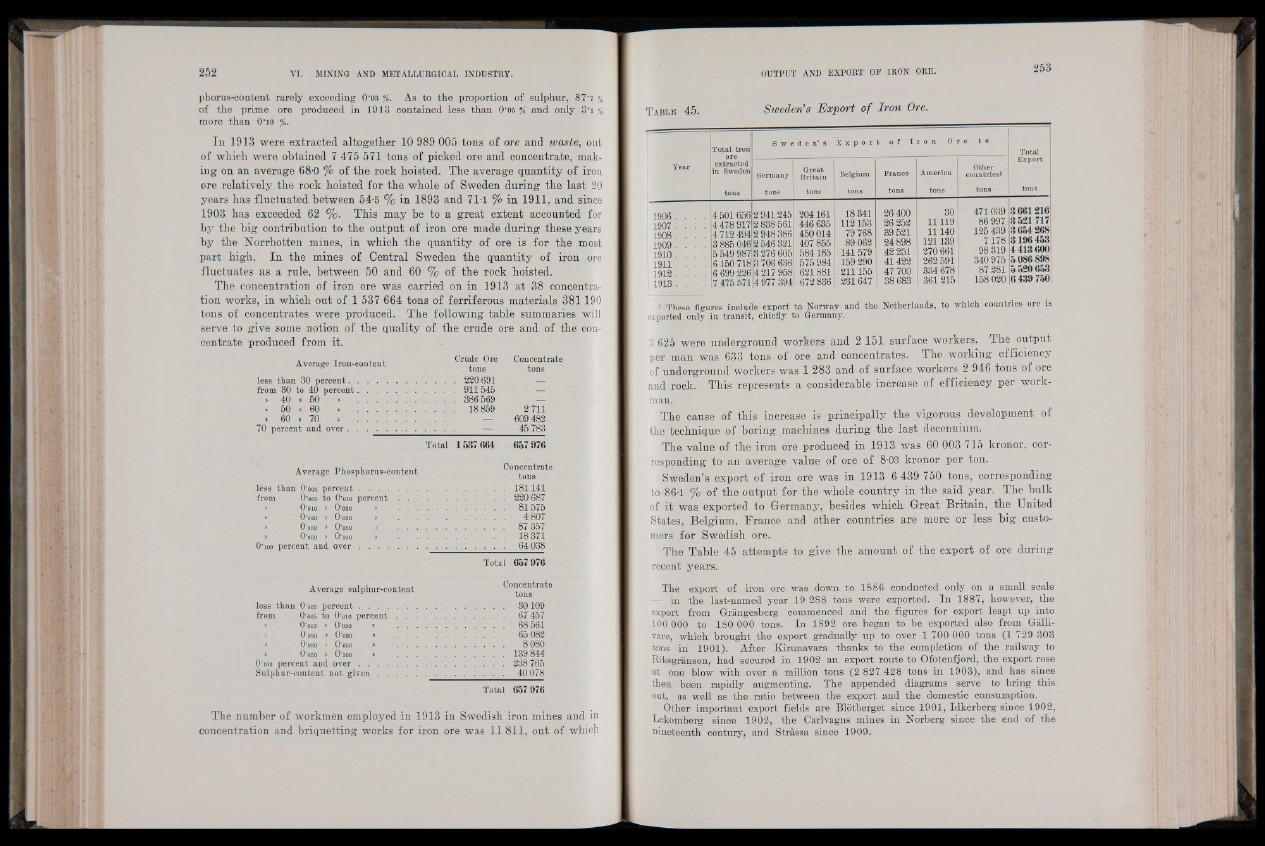
T a b le 45. Sweden's Export o f Iron Ore.
Total iron
•^ore
extracted
in Sweden
S w e d e n ’ s E x p o r t 0 f I r. o n O r e t o
Total
Year
Germany Great
Britain Belgium France America
Other
countries1
Export
tons tons tons tone tons tons tons tons
1906 . . . .
1907 . . . .
1908 . . . .
1909 . . . .
1910 . . . .
1911 . . . .
1912 . . . . .
1913 . . . .
4 501 656
4 478 917
4 712 494
3 885 046
5 549 987
6 150 718
6 699 226
7 475 571
2 941245
2 838 561
2 948 386
2 546 321
3276 605
3 706 636
4 217958
4 977 394
204161
446 635
450 014
407 855
584185
575 984
621881
672 836
18 341
112153
79 768
89 062
141579
159 290
211155
231647
26 400
26 252
39 521
24 898
42 251
41422
47 700
38 683
30
11119
11140
121139
270 661
262 591
334 678
361 215
471 039
86 997
125 439
7178
98 319
340 975
87 281
158 020
3661216
3 521 717
3 654 268
3196 453
4413600
5 086 898
5 520 653
6 439 750
1 These figures include export to Norway and the Netherlands, to which countries ore is
exported only in transit, chiefly to Germany.
3 625 were underground workers and 2 151 surface workers. The output
per man was 633 tons of ore" and concentrates. The working efficiency
of underground workers was 1 283 and of surface workers 2 946 tons of ore
and rock. This represents a considerable increase of efficiency per work-
man.
The cause of this increase is principally the vigorous development of
the technique of boring machines during the last decenninm.
The value of the iron ore produced in 1913 was 60 003 715 kronor, corresponding
to an average value of ore of 8-03 kronor per ton.
Sweden’s export of iron ore was in 1913 6 439 750 tons, corresponding
to 86-1 Jo of the output for the whole country in the said year. The bulk
of it was exported to Germany, besides which Great Britain, the United
States, Belgium, France and other countries are more or less big customers
for Swedish ore.
The Table 45 attempts to give the amount of the export of ore during
recent years.
The export of iron ore was down to 1886 conducted only on a small scale
- in the last-named year 19 288 tons were exported. In 1887, however, the
export from Grangesberg commenced and the figures for export leapt up into
100 000 to 180 000 tons. In 1892 ore began to be exported also from Galli-
vare, which brought the export gradually up to over 1 700 000 tons (1 729 303
tons in 1901). After Kirunavara thanks to the completion of the railway to
Riksgransen, had secured in 1902 an export route to Ofotenfjord, the export rose
at one blow with over a million tons (2 827 428 tons in 1903), and has since
then been rapidly augmenting. The appended diagrams serve to bring this
out, as well as the ratio between the export and the domestic consumption.
Other important export fields are Blotberget since 1901, Idkerberg since 1902,
Lekomberg since 1902, the Carlvagns mines in Norberg since the end of the
nineteenth century, and Strassa since 1909.