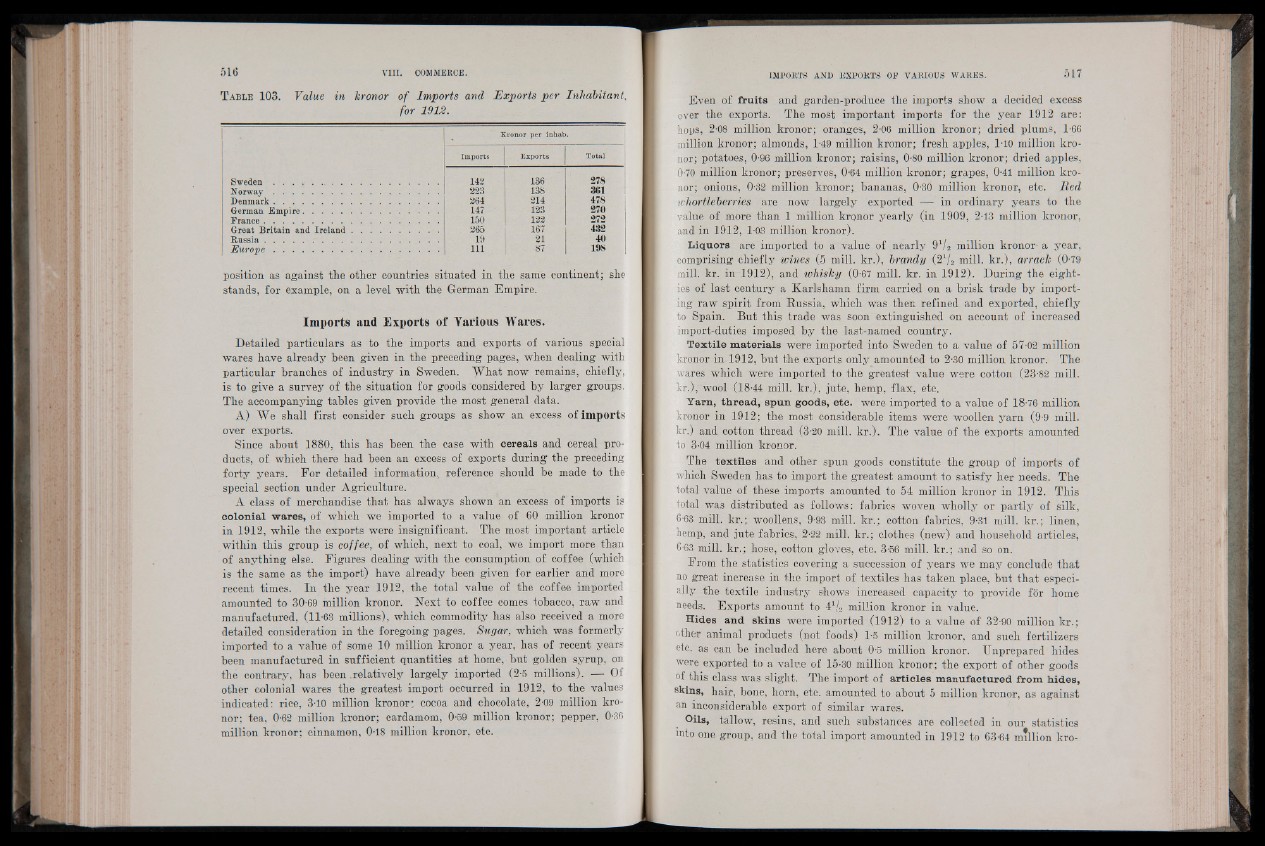
T able 103. Value in kronor of Imports and Exports per Inhabitant,
for 1912.
Kronor per inhab.
Imports Exports Total
S w e d e n ................................................................... 142 136' 278
N o rw a y .................................................................... 223 138 361
Denmark................................................................... 264 214 478
German Empire....................................................... 147 123 270
France ........................................................................ 150 122 272
Great Britain and Ire la n d .................................... 265 167 432
R u ssia ........................................................................ 19 21 40
jE u r o p e ........................... ....................................... 111 87 198
position as against the other countries situated in the same continent; she
stands, for example, on a level with the German Empire.
Imports and Exports of Various Wares.
Detailed particulars as to the imports and exports of various special
wares have already been given in the preceding pages, when dealing with
particular branches of industry in Sweden. What now remains, chiefly,
is to give a survey of the situation for goods ‘considered by larger groups.
The accompanying tables given provide the most general data.
A) We shall first consider such groups as show an excess of imports
over exports.
Since about 1880, this has been the case with cereals and cereal products,
of which there had been an excess of exports during the preceding
forty years. For detailed information, reference should be made to the
special section under Agriculture.
A class of merchandise that has always shown an excess of imports is
co lonia l wares, of which we imported to a value of 60 million kronor
in 1912, while the exports were insignificant. The most important article
within this group is coffee, of which, next to coal, we import more than
of anything else. Figures dealing with the consumption of coffee (which
is the same as the import) have already been given for earlier and more
recent times. In the year 1912, the total value of the coffee imported
amounted to 30-69 million kronor. Next to coffee comes tobacco, raw and
manufactured, (11-63 millions), which commodity has also received a more
detailed consideration in the foregoing pages. Sugar, which was formerly
imported to a value of some 10 million kronor a year, has of recent years
been manufactured in sufficient quantities at home, but golden syrup, on
the contrary, has been .relatively largely imported (2-5 millions). — Of
other colonial wares the greatest import occurred in 1912, to the values
indicated: rice, 3-10 million kronor; cocoa and chocolate, 2-09 million kronor;
tea, 0-62 million kronor; cardamom, 0-59 million kronor; pepper, 0-36
million kronor; cinnamon, 0-18 million kronor, etc.
Even of fruits and garden-produce the imports show a decided excess
over the exports. The most important imports for the year 1912 are:
hops, 2-08 million kronor; oranges, 2-06 million kronor; dried plums, 1-66
million kronor; almonds, 1-49 million kronor; fresh apples, 1-10 million kronor;
potatoes, 0-96 million kronor; raisins, 0-80 million kronor; dried apples,
0-70 million kronor; preserves, 0-64 million kronor; grapes, 0-41 million kronor;
onions, 0-32 million kronor; bananas, 0-30 million kronor, etc. Red
whortleberries are now largely exported — in ordinary years to the
value of more than 1 million kronor yearly (in 1909, 2-13 million kronor,
and in 1912, 1-03 million kronor).
Liquors are imported to a value of nearly 91/2 million kronor-a year,
comprising chiefly wines (5 mill, kr.), brandy (21/2 mill, kr.), arrack (0-79
mill. kr. in 1912), and whisky (0-67 mill. kr. in 1912). During the eighties
of last century a Karlshamn firm carried on a brisk trade by importing
raw spirit from Russia, which was then refined and exported, chiefly
to Spain. But this trade was soon extinguished on account of increased
import-duties imposed by the last-named country.
T ex tile materials were imported into Sweden to a value of 57-02 million
kronor in 1912, but the exports only amounted to 2-30 million kronor. The
wares which were imported to the greatest value were cotton (23-82 mill,
kr.), wool (18-44 mill, kr.), jute, hemp, flax, etc.
Yarn, thread, spun goods, etc. were imported to a value of 18-76 million
kronor in 1912; the most considerable items were woollen yarn (9-9 mill,
kr.) and cotton thread (3-20 mill. kr.). The value of the exports amounted
to 3-04 million kronor.
The te x tile s and other spun goods constitute the group of imports of
which Sweden has to import the greatest amount to satisfy her needs. The
total value of these imports amounted to 54 million kronor in 1912. This
total was distributed as follows: fabrics woven wholly or partly of silk,
6-63 mill, kr.; woollens, 9-93 mill, kr.; cotton fabrics, 9-31 mill, kr.; linen,
hemp, and jute fabrics, 2-22 mill, kr.; clothes (new) and household articles,
6-63 mill, kr.; hose, cotton gloves, etc. 3-56 mill, kr.; and so on.
From the. statistics covering a succession of years we may conclude that
no great increase in the import of textiles has taken place, but that especially
the textile industry shows increased capacity to provide for home
needs. Exports amount to million kronor in value.
Hides and skins were imported (1912) to a value of 32-90 million kr.;
other animal products (not foods) 1-5 million kronor, and such fertilizers
etc. as can be included here about 0-5 million kronor. Unprepared hides
were exported to a value of 15-30 million kronor; the export of other goods
of this class was slight. The import of a rticles manufactured from hide s,
skins, hair, bone, horn, etc. amounted to about 5 million kronor, as against
an inconsiderable export of similar wares.
Oils, tallow, resins, and such substances are collected in our statistics
into one group, and the total import amounted in 1912 to 63-64 million kro