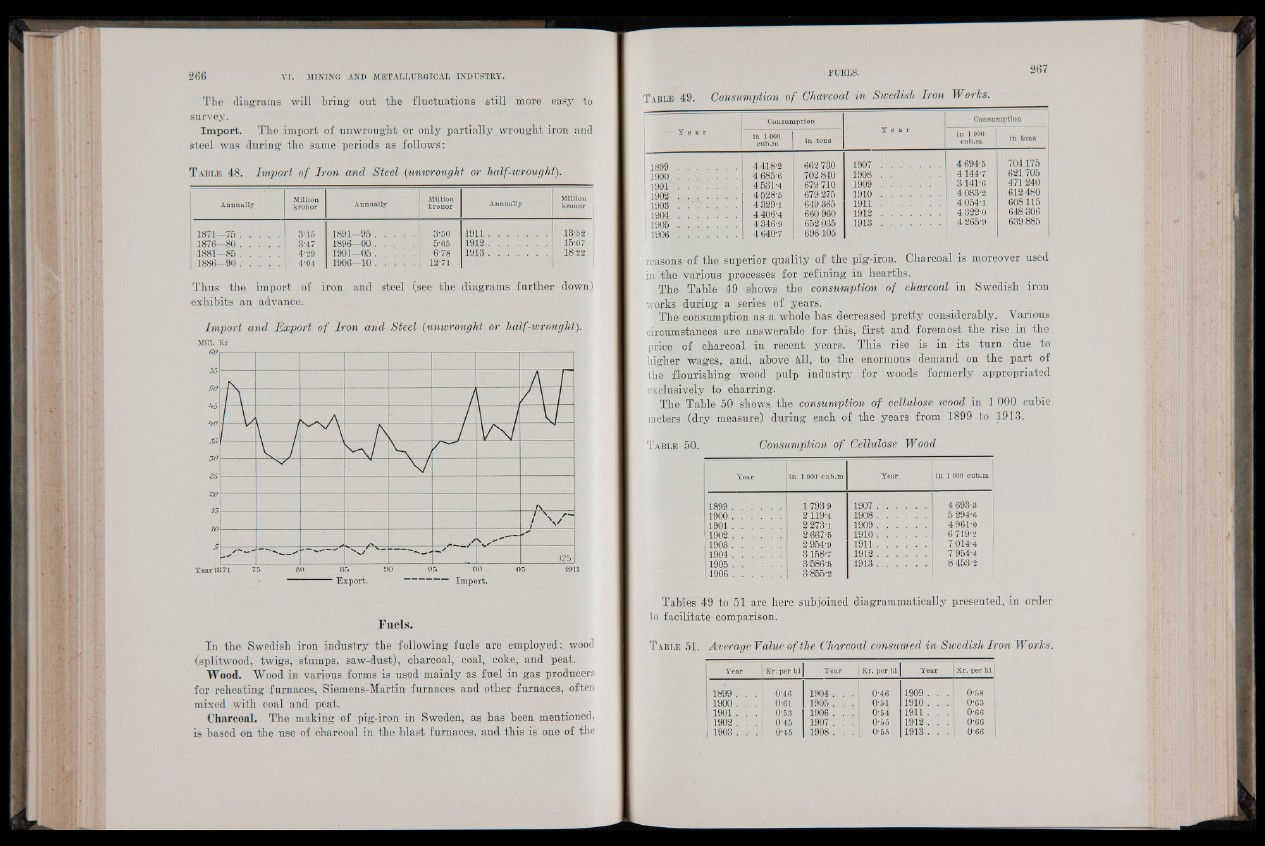
The diagrams will bring out the fluctuations still more easy to
survey.
Im p o rt. The import of unwrought or only partially wrought iron and
steel was during the same periods as follows:
T able 48. Import of Iron and Steel (unwrought or half-wrought).
Annually Million
kronor Annually
Million
kronor Annually Million
kronor
1871—75 ................ 3-15 1891—95 ................ 3-60 1911........................ 13-52
1876—80 . . . . . 3-47 1896—00 ................ 5'05 1912........................ 15-07
1881—85 . . . . .
4-29
1901—05 ................
6-78
1886—90 ................
4-04
1906—10 . . . . .
12-71
1913........................ 18-22
'
Thus the import of iron and steel (see the diagrams further down)
exhibits an advance.
Import and Export of Iron and Steel (unwrought or half-wrought).
Mill. Kr
Export. ” Import.
Fuels.
In the Swedish iron industry the following fuels are employed: wood
(splitwood, twigs, stumps, saw-dust), charcoal, coal, coke, and peat.
Wood. Wood in various forms is used mainly as fuel in gas producers
for reheating furnaces, Siemens-Martin furnaces and other furnaces, often
mixed with coal and peat.
Charcoal. The making of pig-iron in Sweden, as has been mentioned,
is based on the use of charcoal in the blast furnaces, and this is one of the
T a b le 49. Consumption of Charcoal in Swedish Iron Works.
— Y e a r
Consumption
Y e a r
Consumption
in 1000,
cub.m in tons
in 1000
cub.m in tons
1899 ........................ 4 418-2 662 730 1907 . . . . . . . 4 694-5 704175
1900 V. '................ 4 685-6 702 840 1908 . . . . . . 4144-7 621705
1901 . . ' . . . . 4 531-4 679 710 1909 . .................... 3141-6 471240
1902 . . ................ 4 528-6 679275 1 9 1 0 ........................ 4 083-2 612 480
1903 . . , . . 4 329-1 649 365 1 9 1 1 ........................ 4054-1 608115
1904 4 406-4 660 960 1 9 1 2 ................ 4 322-0 648 306
1905 . . . . . . . 4 346-9 652 035 1 9 1 3 ........................ 4 265'9 639 885
1 1906 ........................ 4 640-7 696105
reasons of the superior quality of the pig-iron. Charcoal is moreover used
in the various processes for refining in hearths.
The Table 49 shows the consumption of charcoal in Swedish iron
works during a series of years.
The consumption as a whole has decreased pretty considerably. Various
circumstances are answerable for this, first and foremost the rise in the
price of charcoal in recent .years. This rise is in its turn due to
higher wages, and, above ¿,11, to the enormous demand on the part of
the flourishing wood pulp industry for woods formerly appropriated
exclusively to charring.
The Table 50 shows the consumption of cellulose wood in 1 000 cubic
meters (dry measure) during each of the years from 1899 to 1913.
T a b le 50. Consumption of Cellulose Wood.
Year in 1 000 cub.m Year in 1 000 cub.m
1899 .................... 1793 9 1907 .................... 4 693-3
1900 .................... 2119-4 1908 .................... 5 294-6
1901.................... 2 273-1 1909 .................... 4 961-0
1902 .................... 2 667-5 1910.................... 6 719-2
1903. . . . . . 2 954-9 1911.................... 7 014-4
1904 .................... 3158-7 1912.................... 7954‘4
1905 . . . . . . 3 586-6 1913.................... 8 453 2
1906 .................... 3 855-2
Tables 49 to 51 are here subjoined diagrammatically presented, in order
to facilitate comparison.
T a b le 51. Average Value of the Charcoal consumed in Swedish Iron Works.
Year Er. per hi Year Kr. per hi Year Kr. per hi
1899 . . 0-46 1904 . . 0-46 1909 . . . 0-58
1900 . . . 1 0-61 1905 . . Hf- 0-51 1910 . . . 0-63
1901 . . 0-53 1906 . . 0-54 1911 . . . 0-66
1902 . . . 1 0-45 1907 . . 0"55 1912 . . . 0-66
1903 . . . 1 0-45 1908 . . 0-55 1913 . . . 0-66