3. PRODUCTION OF OTHER METALS.
The iron industry now has such a dominant position in Sweden that
all other metals are comparatively insignificant. This has not always been
the case: during the 16th, 17th, and 18th centuries silver, and still more
copper, were of supreme importance for the industry and economy of
Sweden. During the greater part of the 17th century Sweden was by far
the biggest producer of copper in the world. The maximum output was
reached in 1655, namely 3 453 tons: a quantity then sufficient to cover
the whole world’s consumption of copper. Ever since the 18th century
the Swedish mining industry, setting aside iron, has, on the whole, been
steadily declining: this will be realized very clearly, if we compare it
with the world’s production of these other metals. In recent years,
however, a noticeable improvement has taken place, mainly due to the
invention of electro-metallurgical processes for the manufacture of certain
metals. Whether Sweden’s metal industry shall one day recover its
ascendant position, will depend very much on these electro-metallurgical
processes: whether those processes shall be developed to such perfection,
that they can advantageously replace the smelting processes hitherto in
use. I f this is to be, Sweden has, owing to her abundant supply of
comparatively cheap water-power, very fair prospects for setting on foot
a metal manufacture on a big scale: and this, even if the necessary raw
materials should "not be found within the country in sufficiently large
quantities, and it is necessary, to some extent, to resort to import. The
first step in this direction has been taken by the erection five years ago
T a b l e 63. Manufacture o f certain Other Metals and Metal Products
than Iron.
Annually G o ld S il ve r L e a d Copp er Copper
vitriol Z in c
kg kg tons tons ’ tons tons
1861-65 . . . * . . 15 1129 444 1731 31
1866—70 . . . . 8 1185 395 2 003 95 —
1871—75 ................ 5 780 53 1162 137 —
1876—80 ................ 6 1117 72 925 175 f c 1
1881—85 ................ 25 1713 269 771 — —E
1886—90 ................ 78 4 254 274 835 304 — i
1891—95 ................ 94 3 478 636 480 754 —
1896—00 ................ 110 2110 1519 217 1308 — i
1901-05 ................ 65 1036 735 600 1185 106
1906—10 ................ 17 608 - 473 2 216 545 328 !
1 9 1 1 ........................ 11 1289 1134 3218 320 2123
1 9 1 2 ........................ 31 962 1073 3 957 870 3 228 ,
1 9 1 3 ........................ 25 1037 1235 4 215 j 428 2115 i
T a b l e 64. Imports and Exports of certain other unmanufactured or
pa rtly unmanufactured Metals than Iron.
Annually
Gold
kg
■ S i lv e r
kg
Lead
tons
Co p p e r
tons
Z in c
tons
Total
import
balance of
metals
other than
iron
Import Import Export Import Export Import Export Import Export Million
kronor
1861—65,. 56 5007 10 151 155 196 1487 365 5
1866—70 . 113 8 407 3 083 152 297 268 1804 298 21
187l|¡75 . 1639 9964 6 054 481 137 577 910 658 18 3*2
1876-80 . 1492 1002 1729 593 79 768. 694 959 57 3*7
1881—85 . 659 426 ¡KP 645 253 1084 755 1664 21 2*6
1886—90 . 985 876 168 910 187 1233 662 1765 52 4*6
1891—95 . 386 2 659 2 849 1515 709 3 281 537 1952 86 4*6
1896—00 . 1849 12 779 388 2 055 j 1046 5 021 1155 2708 162 11*6
1901—05 . 564 9 553 180 2 863 I 575 6 453 1733 3 387 228 13*1
1906—10 . 623 16 760 325 3106; 480 8 585 2 446 5108 862 17*2
1911 . . . 366 11230 1,090 2 146 i 1177 5 497 575 5 916 2158 19*0
1912 . . . 320 16 833 2 021 2 309 995 6 807 1586 6 912 3135 16*0
1913 . . . 2104 20 550 4 299 2 6 7 6 Ü 726 9 560 1401 6 018 6 531 17 7
of an establishment for the manufacture of zinc by electricity (see Electrochemical
Industry).
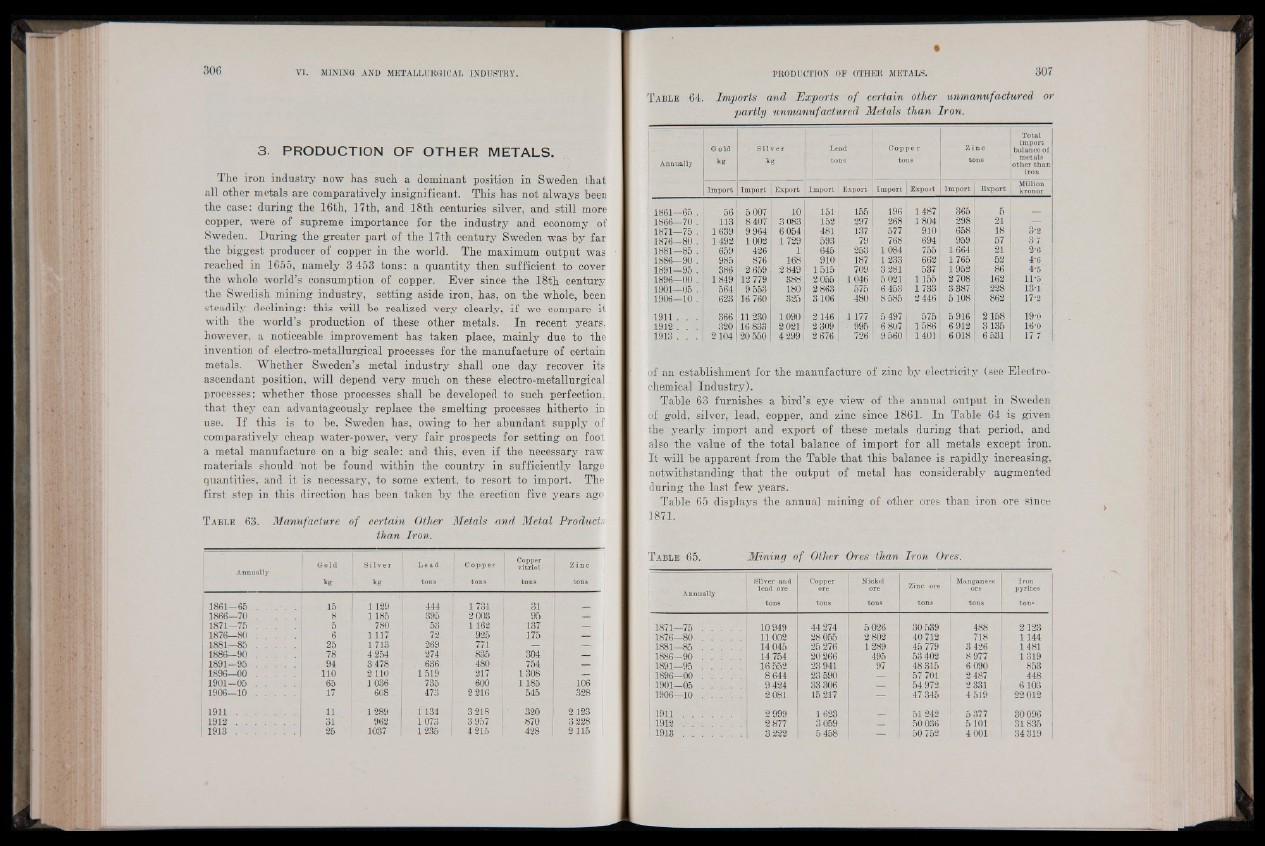
Table 63 furnishes a bird’s eye view of the annual output in Sweden
of gold, silver, lead, copper, and zinc since 1861. In Table 64 is given
the yearly import and export of these metals during that period, and
also the value of the total balance of import for all metals except iron.
It will be apparent from the Table that this balance is rapidly increasing,
notwithstanding that the output of metal has considerably augmented
during the last few years.
Table 65 displays the annual mining of other ores than iron ore since
1871.
T a b l e 65. Mining of Other Ores than Iron Ores.
Annually
Silver and
lead ore
tons
, :Copper
ore
, tons
Nickel Manganese
ore Zmc ore ore
tons tons tons
Iron
pyrites
ton®
1871—75 . . . . . 10 949 44 274 5026 30 539 488 2123
1876—80 ................ 11002 28 055 2 802 40 712 718 1144
1881—85 ................ 14 045 25 276 1 289 45 779 3 426 1481
1886-90 ................ 14 754 20266 495 53 402 8 977 1319
1891—95 ................ 16 552 23 941 97 1 48 315 6 090 853
1896—00 ................ 8 644 23 590 ^ ■ f l N I 2 487 448
1901-05 ................ 9 424 33 306 — Wm 54 972 ! 2 331 6103
1906—10 ................ 2 081 15217 4 7 3 4 5 4 5 1 9 22 012
1 9 1 1 ........................ 2 999 1 623 — 51 242 5 37.7 30 096
1 9 1 2 ........................ 2 877 3059 S l i f e 50 036 Í 5101 31835
1 9 1 3 ........................ 3 222 5 458 50 752 4 001 34 319