the isaue of the above-mentioned “Proclamation” of 1724, however, it made
such rapid progress that towards 1730 it already amounted to about five
hundred vessels. Through the East India Company Swedish shipping with
distant countries was also considerably advanced. A splendid period was entered
upon during the American War of Independence (1775-T-83), in which the
greater maritime powers gradually became involved, owing to which their shipping
declined, to the benefit of the neutral powers. As already indicated above,
the Swedish shipping has probably never been more profitable than during that
time.
The Mercantile Marine.
During the long period of peace which Sweden has enjoyed since 1814,
its shipping has undergone no small development, although its relative
importance is scarcely the same as during preceding periods. Of the combined
mercantile marines of all nations, the Swedish comprised, in 1850,
about 2-66 % — reckoned according to the “reduced” tonnage (see Table
112), and using the epoch-making maritime statistics of A. N. Kiser.
In 1865 this had gone down to 1-92 %. During the next decade, more
especially during the beginning of the decade 1871—80, a tremendous
improvement occurred, which, in 1875, advanced the figures to 3-22|!:%
of the world’s tonnage, but after that came twenty years that constituted
one af the feeblest chapters in the whole history of Swedish
shipping. Then the mercantile marine was not even 2 % of the world’s tonnage.
Since the end of the decade 1891—1900, however, another period of
improvement has been entered upon, and at present the figures for Sweden’s
mercantile marine can be reckoned to be 2-36 % of those given for
the total of the shipping of all countries. -— The progress of the develop
ment since the middle of the nineteenth century appears from Table 112.
T a b le 112. The Swedish Mercantile Marine.
(Before 1900 all vessels; from 1900 inclusive, vessels of 20 tons and over.)
At the end of
Number
of
vessels
Total net
tonnage
Sailing
vessels Steam ships
“Reduced’'
tonnage2
Steamships
Tonnage Tonnage Do. multi- in
plied by 3
Horsepower*
1850 . . . 2 711 205 800 201800 1000 12 000 ? 213800 5-6
1860 . . . 3200 283 600 271 600 12 000 36 000 6 000 307 600 11-7
1870 . . . 3 376 350 200 319 300 30 900 92 700 11601 112000 226
1880 . . . 1333 552100 161 600 90 800 272100 21601 731000 37-1
1890 . . . 3 871 510 917 369 680 111 267 123 801 37 813 793481 53-4
19001 . . . 2 987 613 792 288 687 325 105 975 315 67 317 1264002 77-2
19101 . . . 2 819 769 985 176 912 593 073 Ì 779 219 166110 1956131 9T.0
1911* . . . 2 758 765068 151968 610 100 1830 300 181 805 1985 268 92-2
19121 . . 2 793 805386 153 827 651 559 1 951677 511 111 2 108 501 92-7
1 See note immediately under heading. With regard to the figures previous to 1900, they
are certainly somewhat too high for the tonnage, and much too high for the number of
vessels. — 2 The tonnage of the sailing vessels + three times that of the steam vessels.
— 3 The steam vessels’ effective tonnage (i. e. tonnage multiplied by three) expressed as a
percentage of the whole of the “reduced” tonnage (previous column). — * Before 1910 the
nominal, after 1910 the indicated horse-power.
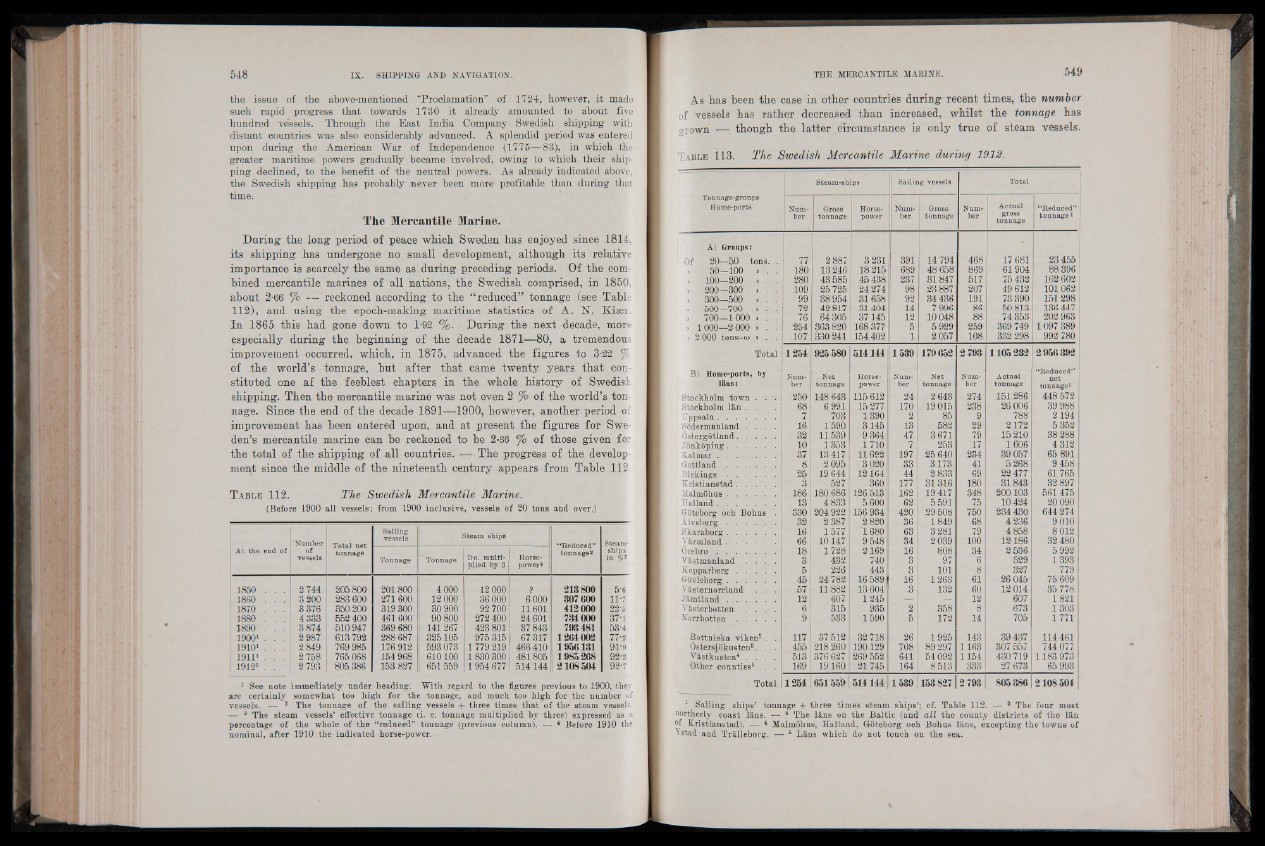
As has been the case in other countries during recent times, the number
of vessels has rather decreased than increased, whilst the tonnage has
grown — though the latter circumstance is only true of steam vessels.
Table 113. The Swedish Mercantile Marine during 1912.
Steam-ships Sailing vessels
Tonnage-groups
Home-ports Number
Gross
tonnage
Horsepower
Number
Gross
tonnage
Number
Actual
gross
tonnage
“Reduced”
to n n ag e1
A) Groups:
Of 20—50 tons. . 77 2 887 3 231 391 14 794 468 17 681 23 455
50—100 > . . 180 13 246 18 215 689 48 658 869 61904 88 396
> 100—200 » . . 280 43 585 45 438 237 31847 517 75432 162 602
> 200—300 > . . 109 25 725 21274 98 23887 207 49 612 101 062
> 800—500 > . . 99 38 954 31658 92 34 436 191 73 390 151298
» 500—700 > . . 72 42 817 31404 14 7 996 86 50 813 136 447
» 700—1000 > . . 76 64 305 37145 12 10 048 88 74 353 202 963
> 1000—2 000 > . . 254 363 820 168 377 5 5929 259 369 749 1097 389
» 2 000 tons-o) > . . 107 330 241 154 402 1 2 057 108 332 298 992 780
Total 1251 925 580 511111 1539 179 652 2 793 1105 232 2 956 392
B) Home-ports, by NumNet
HorseNumNet
NumActual
“Reduced”
Ians: net ber tonnage power ber tonnage ber tonnage tonnage 1
Stockholm town . . . 250 118 643 115 612 21 2 643 274 151286 448 572
Stockholm län . . . . 68 6 991 15 277 170 H 015 238 26 006 39 988
Uppsala........................ 7 703 1390 ' 2 85 9 788 2194
Södermanland . . . . 16 1590 3145 13 582 29 2172 5 352
Östergötland................ 32 11539 9 364 47 3 671 79 15210 38288
Jönköping.................... 10 1353 1710 7 253 17 1606 4 312
Kalmar . . . . . . . 37 13 417 11692 197 25 640 234 39 057 65 891
G o ttla n d .................... 8 2 095 3 020 33 3173y 41 5 268 9458
Blekinge .................... 25 19 644 12161 44 2 833' 69 22 477 61765
Kristi anstad................ 3 527 360 177 31 316 180 31843 32 897
Malmöhus.................... 186 180 686 126 513 162 19 417 348 200103 561475
Halland........................ 13 4 833 5 600 62 5 591 75 10 424 20 090
Göteborg och Bohus . 330 204 922 156 934 120 29 508 750 234 430 644 274
Alvsborg .................... 32 2 387 2 820 36 1849 68 4 236 9 010
Skaraborg .................... 16 1577 1680 63 3 281 79 4 858 8 012
farmland.................... 66 10 147 9 518 34 2 039 100 12186 32 480
Örebro ........................ 18 1728 2169 16 808 34 2 536 5 992
V ästmanland . . . . 3 432 740 3 97 6 529 1393
Kopparberg................ 5 226 413 3 101 8 327 779
Gävleborg.................... 15 24 782 16 589 16 1263 61 26 045 75 609
Västernorrland . . . 57 11882 13 604 3 132 60 12 014 35 778
Jäm tlan d .................... 12 607 1215 A — : 12 607 1821
Västerbotten . . . . 6 315 935 2 358 8 673 1303
No rrb o tten ................ 9 533 1590 5 172 14 705 1771
Bottniska viken2 . . 117 37 512 32 718 26 1925 143 39 437 114 461
Östersjökusten3. . . 455 218 260 190129 708 89 297 1163 307 557 744 077
"Vastkusten* . . . . '5 1 3 376 627 269 552 611 54092 1154 430 719 1183973
Other counties5 . . 169 19160 21745 161 8 513 333 27 673 65 993
Total 1251 651 559 5X4114 1539 153827 2 793 805 386 2108504
1 Sailing ships’ tonnage + three times steam ships’; cf. Table 112. — 2 The four most
northerly coast Ians. — 8 The Ians on the Baltic (and all the county districts of the lan
of Eristianstai|i —.4 Malmohus, Halland, Goteborg och Bohus Ians, excepting the towns of
Ystad and Tralleborg. — 5 Lans which do not touch on the sea.