Total of Imports and Exports with Foreign Countries.
The value of the commercial exchange between Sweden and foreign
countries (specialhandel; special trade) during the time since 1836 is shown
by Table 102 below. During the period 1836—40, it amounted to 57
million kronor annually, but in 1912 it rose to 1 545 millions. The immense
increase is partly to be explained by the fact that, before the middle
of the 19th century, Sweden still lay, as it were, outside the system of
international communications. The period between 1850 and 1870 is one
of transition in this respect to the modern state of things. An enormous
stride lies between the two periods 1866—70 and 1871—75; during the
former, Sweden’s commercial exchange amounted to 259 million kronor
annually, during the latter, to 451 millions, or nearly 75 % more.
In Sweden, as in the majority of European countries to-day, trade statistics
show an inferiority in the money-value of the exports in relation
to that of the imports. It is, however, hardly necessary to enter into a
discussion of the general principles underlying this circumstance, which
show that the difference is, at least in part, only apparent.
As to the very marked increase of imports into Sweden during the last
few years, this is partly to be explained by increased consumption, but
still more by an increased demand for raw materials and machinery for
the very flourishing manufacturing industries.
That the value of the exports has, in certain cases, shown a decrease
is partly explained by the fact of corrections having been made in the
commercial statistics, which formerly put too high unit-values on several
T able 102. Imports and Exports.
Annually Mean
population
Value, in kronor Kronor, per head of
population
Imports Exports Total Imports Exports I Total
1836--40 . . 3 083 000 27 216 000 29887000 57 103000 8-83 9-69
I
18-52 i
1841--45 . . 3 224 000 29149 000 33 519 000 62 668000 9-04 10-40 19-44 !
1846--50 . . 3 389 000 36 405 000 39 915 000 76 320000 10-74 11-78 22-62
1851--55 . . 3 558 000 60144 000 61738 000 121 882 000 16-90 17-36 34-25
1856--60 . . 3 727 000 80 953 000 78 983 000 159 936 000 21-72 21-19 42-91
1861--65 . . 100 826 000 92 467 000 193 293 000 25-25 23-16 48-41
1866--70 . . 4 166 000 132 626 000 126 723 000 259 349 000 31-84 30-42 62-26
1871--75 . . 4 274 000 246 372 000 204 525 000 450 897 000 57-64 47-85 105-49
1876-
1881-
1886-
-80 . .
-85 . .
-90 . .
4 500 000
4 605 000
4 742 000
268 506 000
317 526 000
335 527 000
209 856 000
243 699 000
272 629 000
478362 000
561 225 000
608 156 000
59-66
68-95
.70-76
46-64
52-92
57-49
106-30
121-87 1
128-25
1891--95 . . 4 832 000 351 633 000 318 226 000 669 859000 72-77 65-86 138-63
1896--0 0 . . 5 032 000 452 324 000 358 581000 810 905 000 89-89 71-26 16115
1901--05 . . 5 214 000 533 391 000 410 446 000 943 837 000 102-30 78-72 181-02
1906--10 . . 5 406 000 644 740 Q00 515362 000 1160102 000 119-27 95-33 214-60
1909 5 453 000 616 806 000 472 980 000 1089 780000 113-11 86-74 199-85
1910 5 499 000 671633 000 592 864 000 1264 497 000 122-14 107-81 229-95
1911 5 542 000 696 617 000 663575 000 1360 192 000 125-70 119-73 245-43
1912 5 583 000 793 714 000 760 626 000 1554 340 000 142-17 136*24 278-411
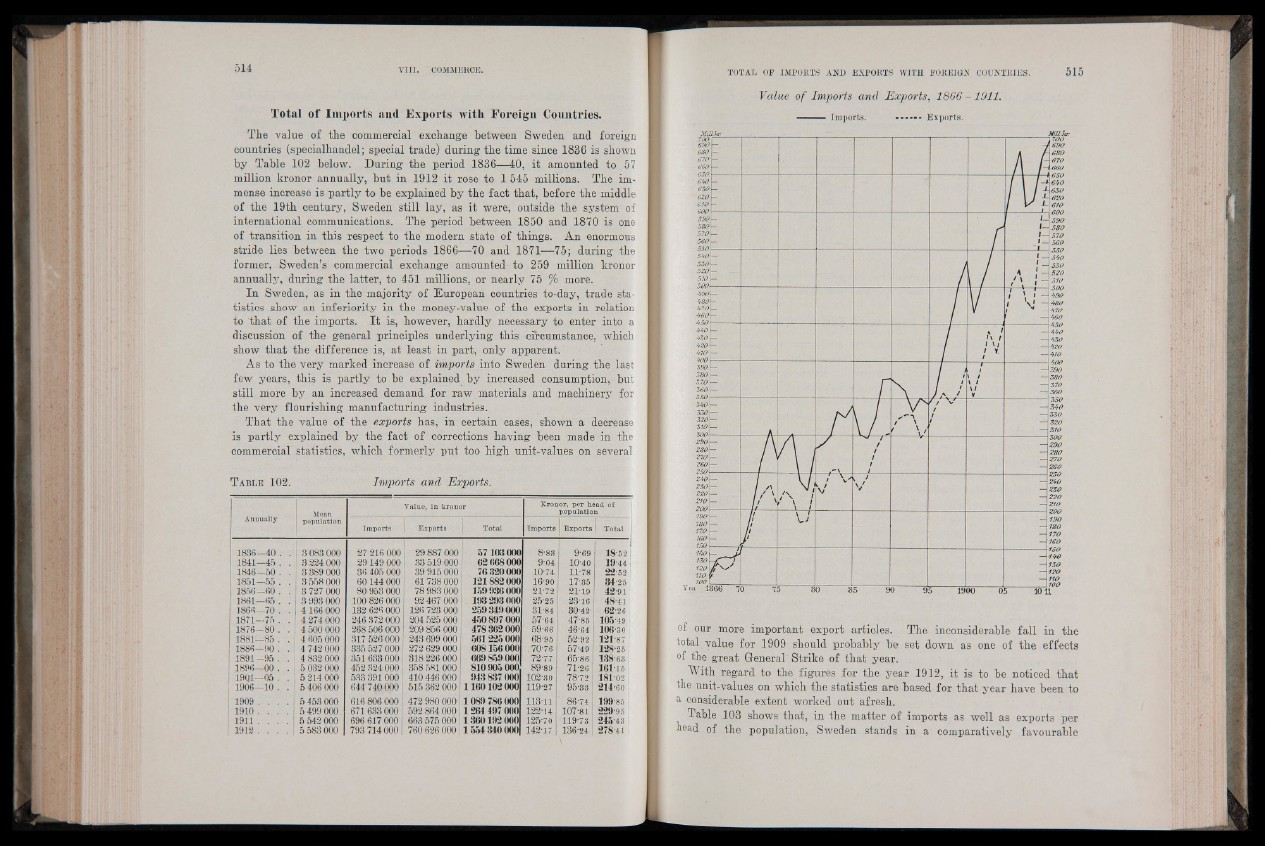
Value of Imports and Exports, 1866 -1 9 1 1 .
Imports. . . . . . . Exports. .
M U lk r — — M R .k r
of our more important export articles. The inconsiderable fall in the
total value for 1909 should probably be set down as one of the effects
of the great General Strike of that year.
With regard to the figures for the year 1912, it is to be noticed that
the unit-values on which the statistics are based for that year have been to
a considerable extent worked out afresh.
Table 103 shows that, in the matter of imports as well as exports per
head of the population, Sweden stands in a comparatively favourable