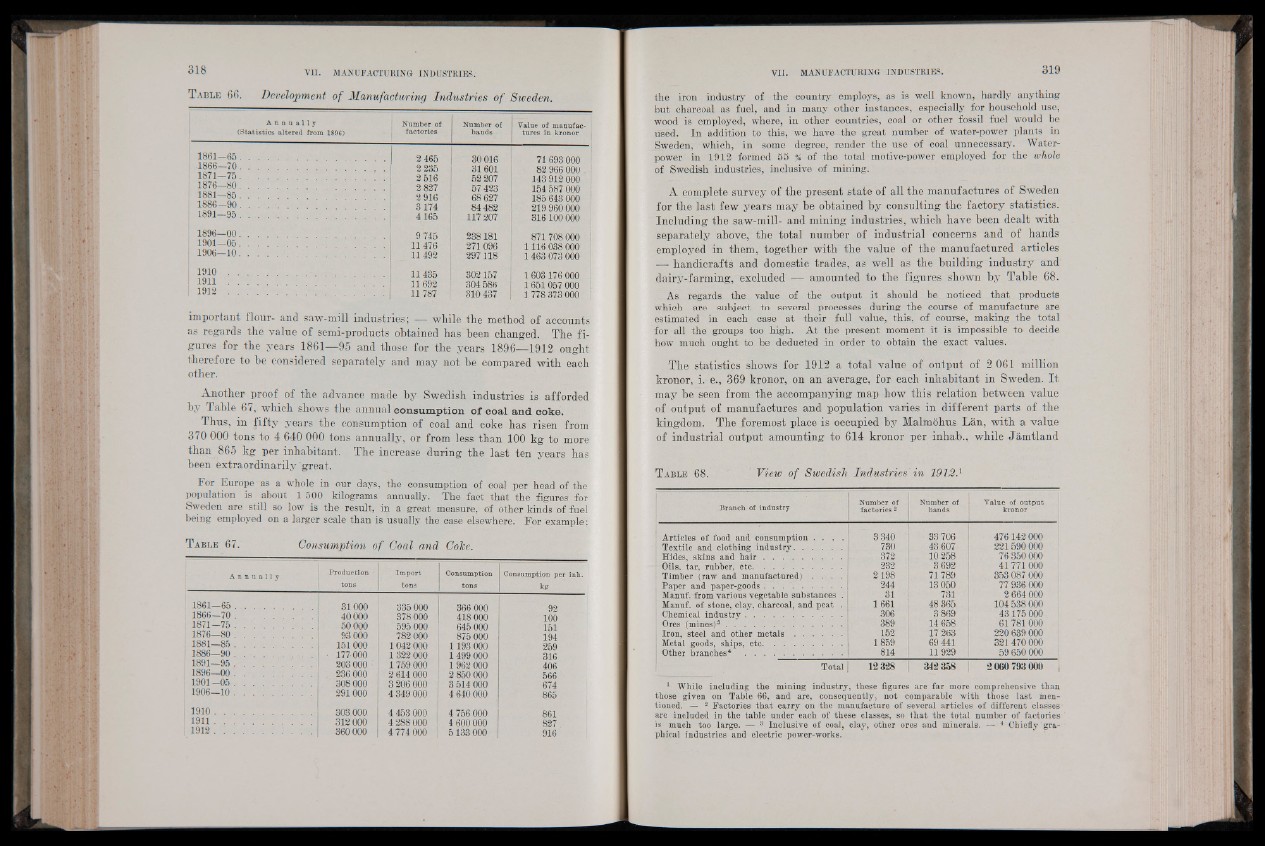
T a b l e 66. Development of Manufacturing Industries of Sweden.
A n n u a l l y
(Statistics altered from 1896)
Number of
factories
Number of
hands--
Value of manufactures
in kronor
1861—65 ................... 2 465 1866—7 0 . . . . 30 016 71 693 000 2 235 31601 82 966 000 1871—-75. . . . 2 516 52 207 143 912 000 1876—80 ............................ 2 827 57 423 154 587 000 1881—85 ........................ 2 916 68627 185 643 000 1886—90 ............... 3174 84482 219 960 000 1891—9 5 .................... 4165 117 207 316 100 000
1896—0 0 ............... 9 745 238 181 871 708 000 1901—0 5 ........................ 11476 271 096 1116 038 000 1906—10........................ 11492 297118 1 463 073 000
1 9 1 0 .................... 11435 302157 1 603176 000 1 9 1 1 ................ 11 692 304 586 1651 057 000 1 9 1 2 .................... 11787 310 437 1 778 373 000
important flour- and saw-mill industries; —- while the method of accounts
as regards the value of semi-products obtained has been changed. The f igures
for the years 1861—95 and those for the years 1896—1912 ought
therefore to be considered separately and may not be compared with each
other.
Another proof of the advance made hy Swedish industries is afforded
by Table 67, which shows the annual consumption o f coal and coke.
Thus, in fifty years the consumption of coal and coke has risen from
370 000 tons to 4 640 000 tons annually, or from less than 100 kg to more
than 865 kg per inhabitant. The increase during the last ten years has
been extraordinarily great.
For Europe as a whole in our days, the consumption of coal per head of the
population is about 1 500 kilograms annually. The fact that the figures for
Sweden are still so low is the result, in a great measure, of other kinds of fuel
being employed on a larger scale than is usually the case elsewhere. For example;
T a b l e 67. Consumption of Coal and CoTce.
A n n u a l l y Production •
tons
Import
tons
Consumption
tons
Consumption per inh.
kg
1861—65 .................... 31000 335 000 366 000 92
1866—70 . . . 40 000 378 000 418 000 100 1871—75 ................................ 50 000 595 000 645 000 151 1876—80 . . . . 93 000 782 000 875 000 194 1881—85 ........................ 151000 1042 000 1193 000 259
1886—90 . .................... 177-000 1322 000 1499 000 316
1891—95 .................... 203 000 1759 000 1 962 000 406
1896—00 ............................ 236 000 2 614 000 2 850 000 566
1901—05 ............................ 308 000 3 206 000 3 514 000 674
1906—10 ................................ 291000 4 349 000 4 640 000 865
1910................................ 303 000 4 453 000 4 756 000 861
1911........................................ 312 000 4 288 000 4 600 000 827
1912........................ 360 000 4 774 000 5 133 000 916
the iron industry of the country employs, as is well known, hardly anything
but charcoal as fuel, and in many other instances, especially for household use,
wood is employed, where, in other countries, coal or other fossil fuel would be
used. In addition to this, we have the great number of water-power plants in
Sweden, which, in some degree, render the use of coal unnecessary. Waterpower
in 1912 formed 55 % of the total motive-power employed for the whole
of Swedish industries, inclusive of mining.
A complete survey of the present state of all the manufactures of Sweden
for the last few years may be obtained by consulting the factory statistics.
Including the saw-mill- and mining industries, which have been dealt with
separately above, the total number of industrial concerns and of hands
employed in them, together with the value of the manufactured articles
— handicrafts and domestic trades, as well as the building industry and
dairy-farming, excluded — amounted to the figures shown by Table 6 8 .
As regards the value of the output it should be noticed that products
which are subject to several processes during the course of manufacture are
estimated in each case at their full value, this, of course, making the total
for all the groups too high. At the present moment it is impossible to decide
how much ought to be deducted in order to obtain the exact values.
The statistics shows for 1912 a total value of output of 2 061 million
kronor, i. e., 369 kronor, on an average, for each inhabitant in Sweden. It
may be seen from the accompanying map how this relation between value
of output of manufactures and population varies in different parts of the
kingdom. The foremost place is occupied by Malmohus Lan, with a value
of industrial output amounting to 614 kronor per inhab., while Jamtland
T a b l e 68. View of Swedish Industries in 19121
Branch of industry
Number of
factories 2
Number of
hands
Value of output
kronor
Articles of food and consumption . . . . 3 340 33 706 476 142 000
Textile and clothing in d u s try ................. 730 43 607 221590 000
Hides, skins and h a i r ................................ 372 10 258 76 350 000
Oils, tar, rubber, etc.................................... 232 3692 41771000
Timber (raw and manufactured) . . . . 2198 71789 353 087 000
Paper and paper-goods . . ......................... 244 13 050 77 936 000
Manuf. from various vegetable substances . 31 731 2 664 000
Manuf. of stone, clay, charcoal, and peat . 1661 48 365 104 538 000
Chemical industry ....................................... 306 3869 43 175 000
Ores (mines)3 ............................................... 389 14 658 61 781 000
Iron, steel and other m e t a ls ................... 152 17 263 220 639 000
Metal goods, ships, etc................................. 1859 69 441 321 470 000
Other branches4 ........................................ 814 11929 59 650 000
Total 123-28 34-2 358 2 060 793 000 |
1 While including the mining industry, these figures are far more comprehensive than
those given on Table 66, and are, consequently, not comparable with those last mentioned.
— 2 Factories that carry on the manufacture of several articles of different classes
are included in the table under each of these classes, so that the total number of factories
is much too large. — 3 Inclusive of coal, clay, other ores and minerals. — 4 Chiefly ’graphical
industries and electric power-works.