during1 recent decades, thanks to improved shipping communications. Thus
for the following years, the value of the exports from Sweden, expressed
in thousands of kronor, are as given in the table below.
1905 1908 1910 1911 1912
British South Africa . . . . . . 4 567 3 844 9 089 7183 6 949
British East Indies . . . . . . . 3 226 3 549 4 478 4 585 5 955
■China.................................... . . . 733 504 1381 1840 1255
Japan .................................... . . . 608 2 274 5 565 5 866 6 359
Australia................................ . . . 2 693 5080 8 895 9 800 8499
The A rg e n tin e .................... . . . 1100 3 032 5183 7 422 9 405
Uruguay ................................ . . . 40 94 346 842 571
B r a z il .................................... . . . 609 651 1256 1412 2 485
Customs.
With regard to matters concerning Commercial Policy, the reader may consult
the special article below.
In order to give an approximate comparison in the matter of customs be- I
tween Sweden and other countries from which figures are available, a few guid- I
ing data are given below. (In the case of Sweden the figures are taken from I
the returns for the year 1912; for other countries the figures represent an ave- I
rage for the period 190 5—09.)
Customs collected.
Per inhab. As percentage
Countries kronor of imports
Sweden................................................ ................11-53 8-2
Norway............................!■ . . . . ................17-94 11-9
D e nm a rk ............................................ ................14-14 ■ 6*5
Great Britain and Ireland . . . . 6-1
German Em p ire ................................ ................ 9-30 7-8
Switzerland........................................ ................14-14 4 3
France . . . . ................................ ................ 916 8-0
Spain. . . ( .................................... 5-35 14-5
United States of America . . . . . ................13-00 23-0
How the conditions in this respect have changed in Sweden at different times
is shown by the following figures:
Customs receipts
Annually Mean
pop.
Value of
imports, kr.
Customs
receipts, kr.
Per inhab.,
kronor.
In % of
imports
1841—50 .
1851—60 .
1861—70 .
1871—80 .
1881—90 .
1891—95 .
1896—00 .
1901—05 .
1906—10 .
3 306 000
3 642 000
4 079 000
4 387 000
4 673 000
4 832 000
5 032 000
5 214000
5 406 000
32 774000
70 549 000
116 726 000
257 439 000
326 529 000
351633 000
452 324 000
533 391 000
644 740 000
5 983000
10 270000
13 731 000
23 690 000
33 969 000
37372 000
50 419 000
55 704 000
59 010 000
1-81
2-82
3-37
5'40
7-27
7-73
10:02
lO-6 8
10-92
18-3 %
14-6 >
11-8 »
9:2 >
10-4 »
10*6 >
-l l T »
10 4 »
9-2 »
1911 . . 1
1912 . . .
5 542 000
5583 000
696 617 000
793 714 000
60 273 000
64 350 000
10-88
11-53
8-7 >
8t »
The transition to a system of freer trade, which followed immediately upon
the year 1850, can be traced here with great clearness. With regard to the results
of the new tariff of June 9th, 1911 (which came into force on Dec. 1, in
the same year) reference should be made to the above mentioned separate article
on Commercial Policy, from which more detailed information can be gained.
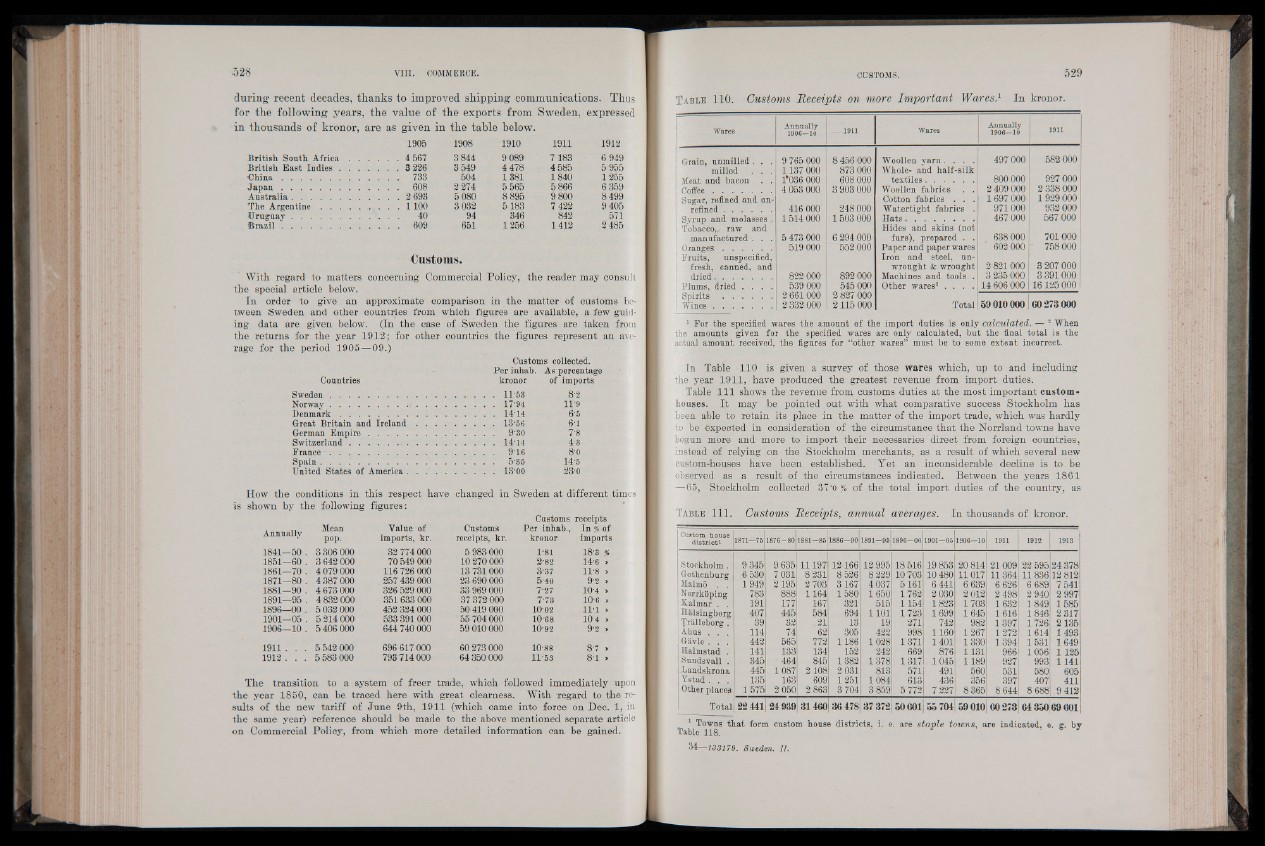
Table 110. Customs Receipts on more Important Wares.1 In kronor.
Wares Annually
1906—10 ___1911 Wares
Annually
1906—10 1911
G ra in , u nm ille d . . . 9 765 000 8 456 000 "Woollen y a r n . . . . 497 000 582 000
milled , . . 1137 000 873 000 Whole- and half-silk
Meat and bacon . . 1*036 000 608 000 textiles................... 800 000 927 000
Coffee........................ 4 053 000 3 903 000 Woollen fabrics . . 2 409 000 2 338 000
Sugar, refined and unCotton
fabrics . . . 1697 000 1929 000
refined . . . . . . 416 000 248 000 Watertight fabrics . 971 000 932 000
Syrup and molasses . 1 514 000 1503 000 Ha ts............................ 467 000 567 000
Tobacco,/ raw and Hides and skins (not
manufactured . . . 5 473 000 6 294 000 furs), prepared . . 638 000 701000
Oranges.................... 519 000 552000 Paper and paper wares 602 000 ■ 758 000
Fruits, unspecified, Iron and steel, unfresh,
canned, and wrought & wrought 2 821 000 3 207 000
dried. . . . . . . 822 000 892 000 Machines and tools . 3 235 000 3 391 000
Plums, dried . . . . 539 000 545 000 Other wares2 . . . . 14 606 000 16 125 000
S p i r i t s .................... 2 661 000 2 827 000
Wines........................ 2 332 000 2115 000 Total 59 010 000 60 273 000
1 For the specified wares the amount of the import duties is only calculated. -#-i2 When
the amounts given for the specified wares are only calculated, but the final total is the
actual amount received, the figures for “other wares” must be to some extent incorrect.
In Table 110 is given a survey of those wares which, up to and including
the year 1911, have produced the greatest revenue from import duties.
Table 111 shows the revenue from customs duties at the most important customhouses.
It may be pointed out with what comparative success Stockholm has
been able to retain its place in the matter of the import trade, which was hardly
to be expected in consideration of the circumstance that the Norrland towns have
begun more and more to import their necessaries direct from foreign countries,
instead of relying on the Stockholm merchants, as a result of which several new
custom-houses.;- have been established. Yet an inconsiderable decline is to be
observed as a result of the circumstances indicated. Between the years 1861
—65, Stockholm collected 37*o % of the total import duties of the country, as
T ab le 111. Customs Receipts, annual averages. In thousands of kronor.
Custom house
d istrict1 1871—76 1876-80 1881—86 1886—90 1891—96 1896-00 1901—06 1906—10 1911 1912 1913
Stockholm . 9 345 9 635 11 197 12 166 12 995 18 516 19 853 20 814 21 009 22 595 24378
Gothenburg 6 530 7 031 8 231 8 526 8229 10 703 10 480 11017 11364 11836 12 812
Malrno . . 1 949 2195 2 703 3167 4037 5161 6 441 6 639 6 626 6 689 7 541
Norrkoping 783 888 1164 1580 1650 1762 2030 2 012 2 498 2 940 2 997
Kalmar . . 191 177 167 321 515 1154 1823 1703 1632 1849 1585
Halsingborg 407 445 584 694 1101 1723 1699 1645 1616 1846 2 317
Tralleborg . 39 32 .21 13 19 271 742 982 1397 1726 2135
Ahus . . . 114 74 62 305 422 998 1160 1267 1272 1614 1493
G&vle . . 442 565 772 1186 1028 1371 1401 1330 1394 1531 1649
Halmstad . 141 133 134 152 242 669 876 1131 966 1056 1 125
Sundsvall . 345 464 845 1382 1378 1317 1045 1189 927 993 1141
.Landskrona 445 1087 2108 2 031 813 571 491 560 531 580 605
Ystad . . 135 163 609 1251 1084 613 436 356 397 407 411
Other places 1 575 2 050 2 863 3 704 3 859 5 772 7227 8 365 8 644 8688 9 412
Total 22 441 24 939| 3146o| 36 478 37 372 50 601 55 704| 59 010 60 273 64850 69601
1 Towns that form custom house districts, i. e. are staple towns, are indicated, e. g. by
Table 118.