paratively many more, while the married women are more strongly
represented in the rural districts.
The number of divorced husbands and wives is considerably
smaller in Norway than in most European countries.
DISTRIBUTION ACCORDING TO STATION IN LIFE,
AND OCCUPATION.
Iii recent censuses in various countries, special importance
has been attached to the obtaining of minute and accurate information
as to the position and occupation of the persons
enumerated, matters which, with the ever-increasing interest in
the material conditions of the people and the advancement of
business, are of very .great importance. The information on these
matters, obtained by the censnses, affords, as a rule, the best and
most reliable that can be. obtained concerning the importance
of the various livelihoods for the economy of the entire nation.
Comparison, also, of one census with another, yields excellent
material for throwing light upon the development, stagnation or
retrogression of the several means of livelihood in the course
of time.
In Norway too, very detailed information has been obtained
concerning these matters, by the censuses. A brief résumé will be-
given here of their principal results.
The first question that présents itself is: How large a portion
of the population of the country can be described as wording?
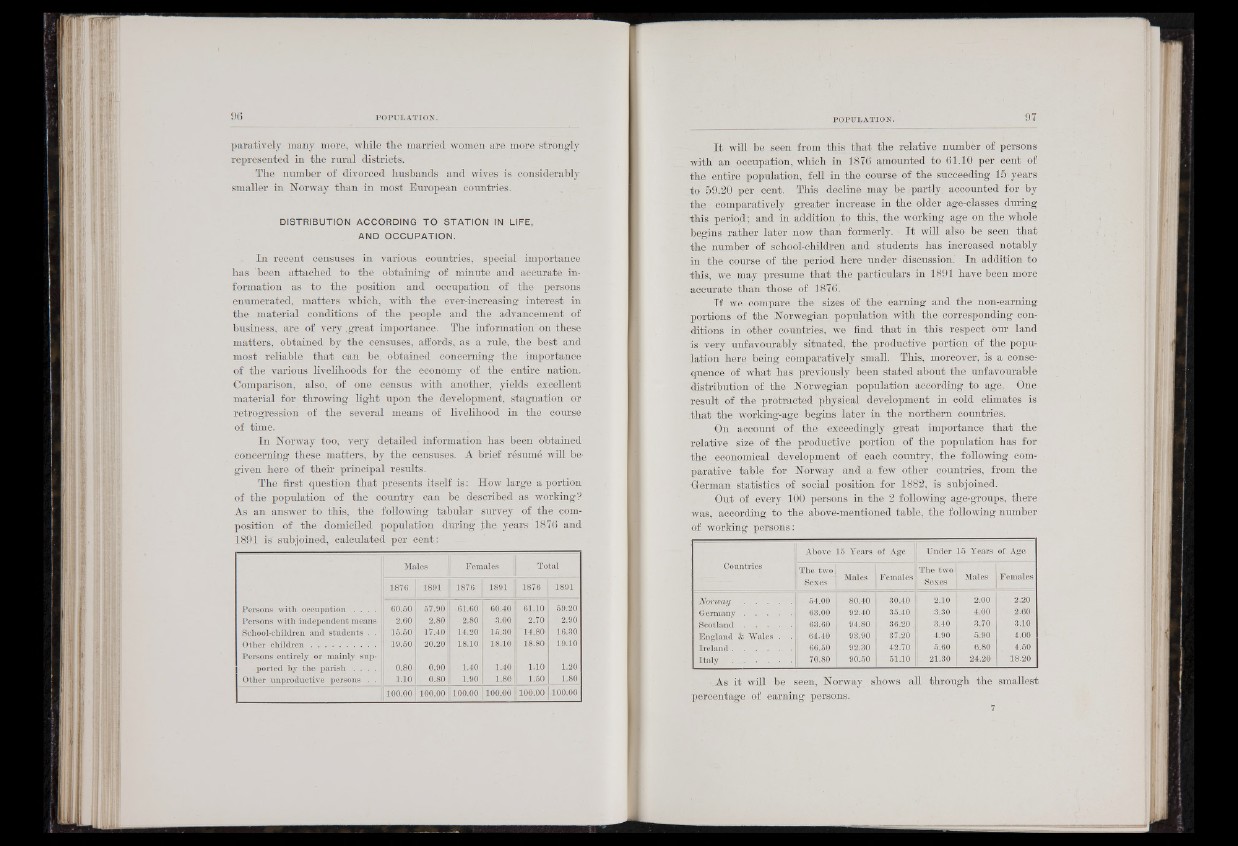
As an answer to this, the following tabular survey of the composition
of the domiciled population during the years 1876 and
1891 is' subjoined, calculated per cent.:
Males Females Total
1876. 1891 1876 1891 1876 1891
Persons with occupation . . . .
Persons with independent means
School-children and students . .
Other c h ild r e n ............................
Persons entirely or mainly supported
by the parish . . . .
Other unproductive persons . .
60.60
2.60
15.50
19.50
0.80
1.10
67.9.0
2.80
17.40
20.20
•0.90
0.80
61.60
. 2.80
14.20
18.10
1.40
1.90
60.40
3.00
15.30
18.10
1.40
1.80
61.10
2.70
“14.80
18.80
1.10
1.50
69.20
2.90
16.30
19.10
1.20
1.80
100.00 100.00 10.0.00 100.00 100.00 -100.00
I t will be seen from this that the relative number of persons
with an occupation, which in 1876 amounted to 61.10 per cent of
the entire population, fell in the course of the succeeding 15-years
to 59.20 per cent. This decline may be partly, accounted for by
th e . comparatively greater increase in the older age-classes during
this period ; and in addition to this, the working age on the whole
begins rather later now than formerly. I t will also be seen that
the number of school-children and students has increased notably
in the course of the period here under discussion. In addition to
this, we may presume that the particulars in 1891 have been more
accurate than those of 1876.
If we i compare the sizes of the earning and the non-earning
portions of the Norwegian population with the corresponding conditions
in other countries, we find that in this respect bur land
is verytjfnfavourably situated, the, productive portion of the population
here being comparatively small. This, moreover, is a consequence
of what has previously been stated about the unfavourable
distribution of the Norwegian population according to age. One
result of the protracted physical development in cold climates is
that the working-age begins later in the northern countries.
On account of the exceedingly great importance that the
relative size of th e ; productive portion of the population has for
the economical development of each country, the following comparative
table for Norway and a few other countries, from the
Herman statistics of social position for 1882, is subjoined.
Out of every 100 persons in the 2 following age-groups, there
was, according to the above-mentioned table, the following number
of working persons :
Countries
Above 15 Years of Age Under 15 Years of Age
The two
Sexes Males Females
The two
Sexes Males Females
N o r w a y .....................
Germany
Scotland . . . . .
England & Wales .
Ire la n d ..........................
Italy .......... . . .
54.00
63.00
63.60
64.40
66.50
70.80
80.40
92.40
94.80
93.90
92.30
90.50
30.40
35.40
36.20.
37.20
42.70
61.10
2.10
3.30
3.40
4.90
5.60
21.30
2.00
4.00
3.70
6.90
6.80
24.20
2.20
2.60
3.10
4.00
4.50
18.20
■ As it will be seen, Norway shows all through the smallest
percentage of earning persons.