there were 4.55 persons in each household in Norway in 1891.
The corresponding figure for England and Wales was 4.78, for
Germany 4.66 and for Sweden 3.80.
The average number of inhabitants to each dwellinghouse
amounted in 1891 to 6.50 for the whole kingdom, and for the
country districts and the towns separately, 5.78 and 11.85* respectively.
While the density of our population has risen in several
of our towns, in consequence of the increasing taste for a barracklike
manner, of building, the country districts in this respect
exhibit a contrary tendency. The number of inhabitants per house
was greatest in Kristiania, viz. 22.90 (as against 21.90 in 1876), while
the next largest Norwegian town, Bergen, had only 13.10 (11.70 in
1876), and Trondhjem 11.90 (12.20 in 1876). In the country districts,
the difference between the various parts is comparatively small.
DISTRIBUTION ACCORDING TO SEX.
If we compare the distribution of the Norwegian population
according to sex, with the corresponding conditions in other countries,
we find that there is a greater preponderance of the female-
sex in our land than in most of the European countries, and also
that of late years, this preponderance has been on the increase.
In the year 1891, the Norwegian women numbered 1,035,006, as
against 965,911 men, or an excess of 69,095 women; while in 1876,
it only amounted to 42,688. In 1891, there were 1072 women to
a thousand men, as against 1048 in 1876. If the proportion at
an earlier date be investigated, it will be found that according to
the census of 1801, the excess of women was 8.90 per cent, Nut
that owing to a diminished death-rate, it fell to a!n average of 4 °/o
during the years 18155—1870. Since that-time, emigration has
once more considerably increased the relative number of women.
The average proportion of strength between the two sexes for
Europe in the beginning of the nineties is calculated at about 1021,
while the other continents, in so far as particulars are forthcoming,
all exhibit an excess of the male sex. In Sweden, in 1894,
the proportion was 1061, in Denmark, in 1893, .1053. Among the
countries of Europe, -only Portugal has a larger excess of women
than Norway, namely, 1084 women to every 1000 men.
There is, moreover, considerable difference in the proportion
between the rural districts — which in 1891 had an average of
1058 women to every 1000 men Aw, and the towns, where the sexes
are divided in the proportion of 1206 women to 1000 men. The
large excess of women in the towns is due in a great measure to
the influx of domestic servants.
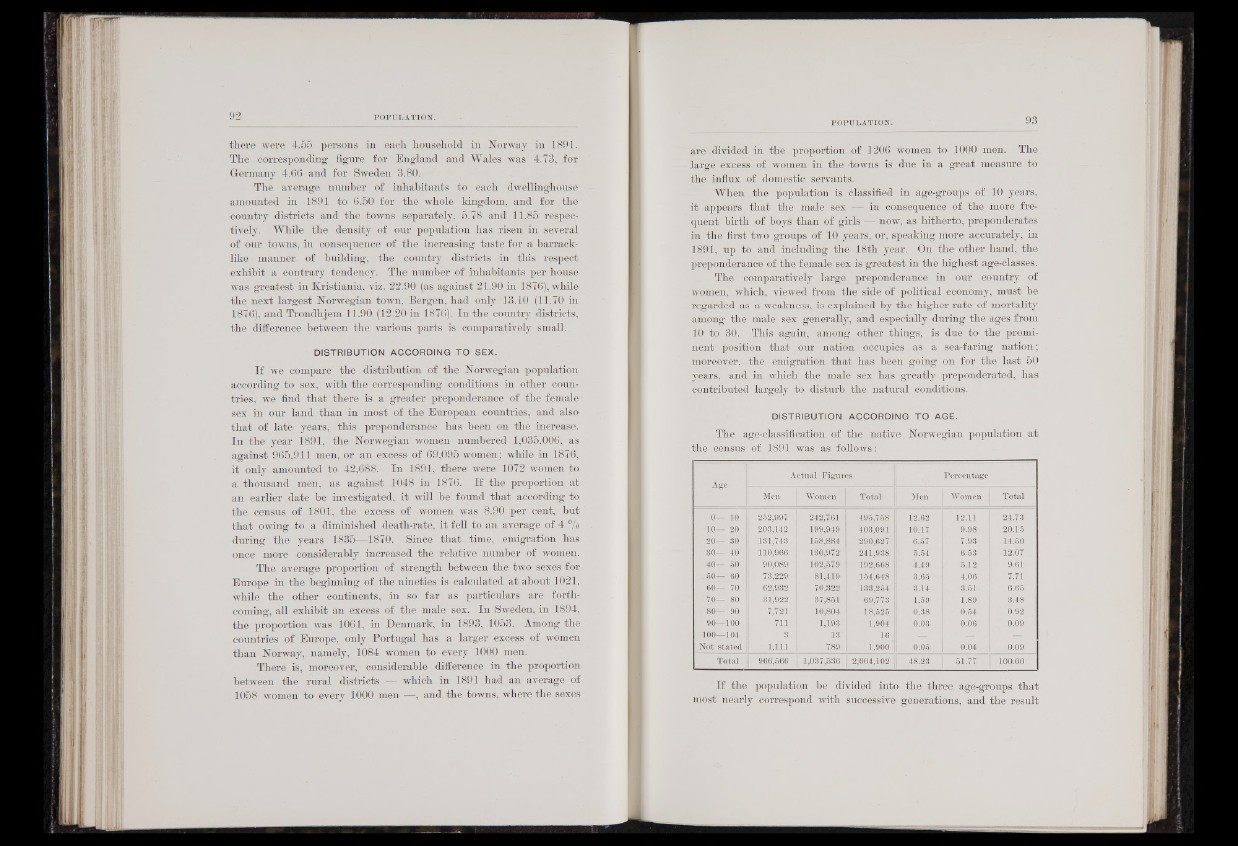
When the population is classified in age-groups of 10 years,
it appears that the male sex — in consequence of the more frequent
birth of boyé than of girls -£i; now, as hitherto, preponderates
in the first two groups of 10 years, or, speaking more accurately, in
189,1, up to and including the 18th year.. Oh the other hand, the
preponderance of the female sex is greatest in the highest age-classes.
The comparatively large preponderance in our country of
women, which,' viewed from the side of political economy, must be
regarded as a weakness, is explained by the higher rate of mortality
among the male sex generally, and-especially during the ages from
10 to 30. This again, among other things., is due to the prominent
position that our nation occupies as a sea-faring nation;
moreover,, the emigration that has been going on for the last 50
years, and in which the male sex has greatly preponderated, has
contributed largely to disturb the natural, conditions.
DISTRIBUTION ACCORDING TO AGE.
The age-classification of the native Norwegian population at
the census of 1891 was as follows:
Age
Actual Figures Percentage
Men Women Total Men Women Total
0'-^ .10 262,997 242,761 495,758 12.62 12.11 24.73
10— 20 203,142 199,949 403,091 10.17 9.98 20.15
20— 30 -131,743 158,884 290,627 6.57 7.93 14.50
ÜW 40 110,966 130,972 241,938 5.54 6.53 12.07
40— 50 | 90,089 102,579 192,668 4.49 5.12 9.61
B U M 60 73,229 81,419 154,648 3.65 4.06 | 7.71
60— 70 62,932 70,322 133,264 3.14 3.51 6.65 |
70— 80 31,922 37,861 69,773 1.59 1.89 3.48
80— 90 7,721 10,804 18,525 0.38 • 0.54 0.92
90—100 • 7ii!v. 1,193 1,904 0.03 0.06 0.09
100—104 3 13 ' 16 Í |¡ ¡ Í ^ —
Not stated 1,111 789 1,900 0.06 0.04 •0.09
Total 966,666 3|,037,536 2,004,102 48.23 51.77 100.00
If the population be divided into the three age-groups that
most nearly correspond with successive generations, and the result