small difference between the principal economic groups of the
population. There is especially in the numerous small farmers’
and country artisans’ class a considerable proportion whose financial
conditions do not differ from those of the ordinary, working-man
I t is also an important fact, from a social-economi^ point of
view, that the average income of employers is even less than the'
average pay of the employees. A comparatively trifling decrease
in the earnings of the employers would therefore bring a laro-e
number of them over into the ranks of the employees, or even
of the working-men.
Labour-wages have, on the whole, been rising, though in
different degrees for the country labourer and the town labourer,
and also for working-men in thé various branches of trade. The
percentage of artisan apprentices, for instance, with an annual
income of from 200 to 299 kr., has risen, between 1885 and 1894,
from 9.3 to. 14, and in the income-group 300 to 499 kr., from 7.9 to
10.7. The percentage of seamen in the income-group 200 to 399 kr
has risen from 25.9 to 31.3, and so on. In thè case of domestic
servants and factory girls, there is also an improvement in the
incomes, principally owing to the decrease in the percentage in
the lowest income-groups. According to various statements, it
must be assumed that the working-men’s incomes from 1890 to
1898 have increased by an average'of at least 15 per cent.
The women's — married and unmarried taken together —4
average returns for their work are calculated to be about 253 kr.
annually.
In order to illustrate more clearly the standard of life of the
population, it may be stated that the greater part of the earnings of
the working-classes go to the purchase of food. I t is calculated that
in general more than 45 per cent of the labour profits go towards
food, and about 15 per cent towards clothes. I t is also* well-
known that the expenditure on food diminishes per cent* as the
higher income-classes are reached, or in other words ¡jgjiin the
lower wages-classes the toil for the necessities of life is that in which
the activity of life principally centres. The question then arises,
what does living cost in Norway? According to investigations on
this subject, which, however, are scarcely to be relied on, meat
and drink such as" would completely satisfy the requirements for
maintaining the bodily organism in full vigour, might be obtained
for about 160 kr. per head per annum.
According to the above calculation, the Norwegian nation
spends 340,000,000 of their 700,000,000 kroner’s national income
annually on articles of food. I t need hardly be said that this
calculation is only built upon exceedingly insufficient data, and
at any rate can only in the case of the poorer classes give an
approximately correct idea of the cost of articles of diet in proportion
to the income.
I t may, on the other hand, be said with greater certainty,
that, as a rule, the Norwegian working-classes are well-fed, and
certainly better than the corresponding classes in most other countries.
The working-men in the country especially, live in comparatively
easy circumstances, both as regards food and .lodging.
SOBRIETY.
The position of the Norwegian nation with regard to sobriety
will perhaps appear most clearly from the following comparison
with other lands. *
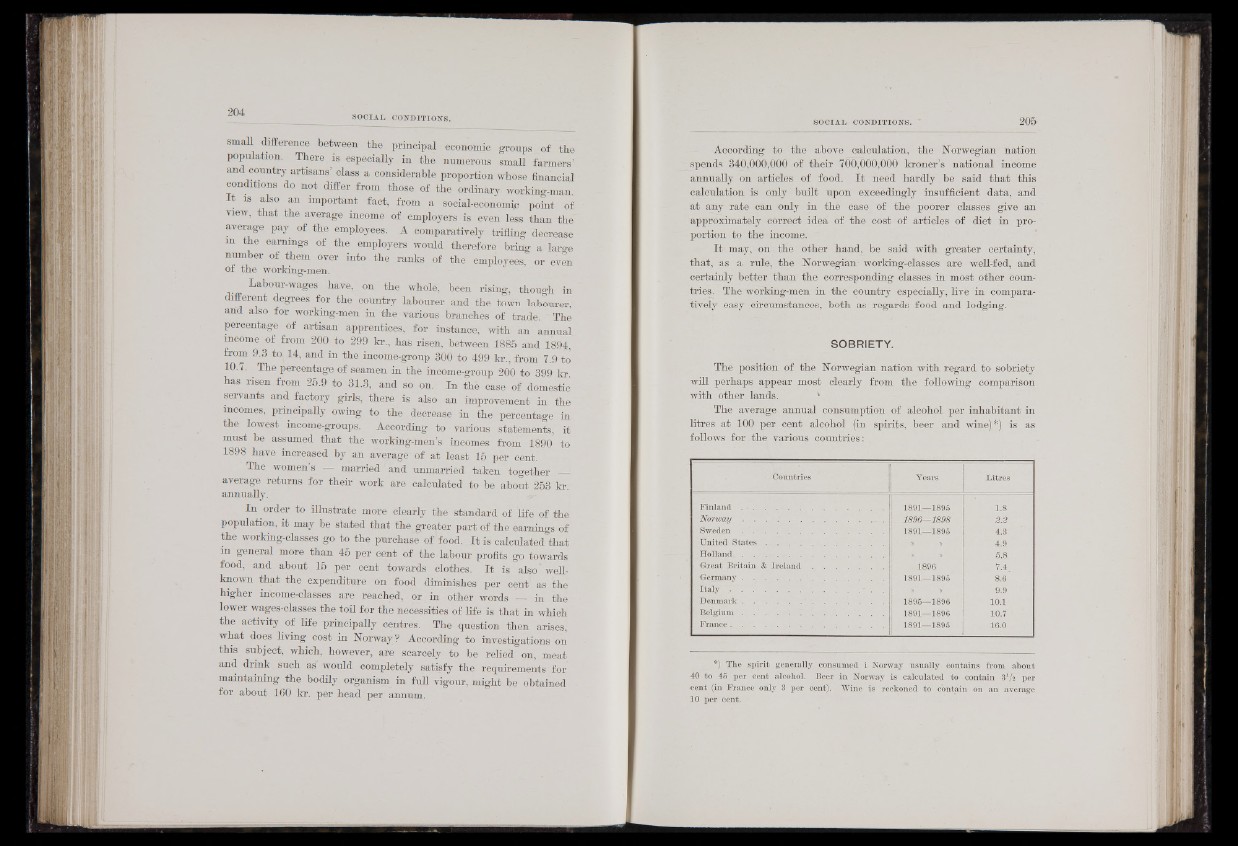
The average annual consumption of alcohol per inhabitant in
litres at 100 per cent alcohol (in spirits, beer and wine)*) is as
follows for the various countries:
. Countries Years Litres
Finland . . . , . . : . . . . . . . 1891—1895 1.8
Norway . . . | . . \ . . . . • 1896—1898 . 2.2
Sweden . . . ! ..................................... 1891—1895 4.3
United S t a t e s ............................... ..... O'-V,.’ •• » 4.9
Holland. . . | . . . . . . I . . . 6.8
Great Britain & Ireland . . . . . . ¡M 1896 7.4
Germany . | . . . . ' . | §__ nH H H 1891—1895 8.6
I t a l y ............................................... ..... ." . . S | | f| »■ 9.9
Denma rk .............................................................. 10.1
Belgium . .......................................... ..... . 1891—1896 10.7
1891i#1895 16.0
®) The spirit generally consumed i Norway usually contains from ahout
40 to 45 per cent alcohol. Beer in Norway is calculated to contain 3Va per
■cent (in France only 3 per cent), Wine is reckoned to contain on an average
10 per cent. -