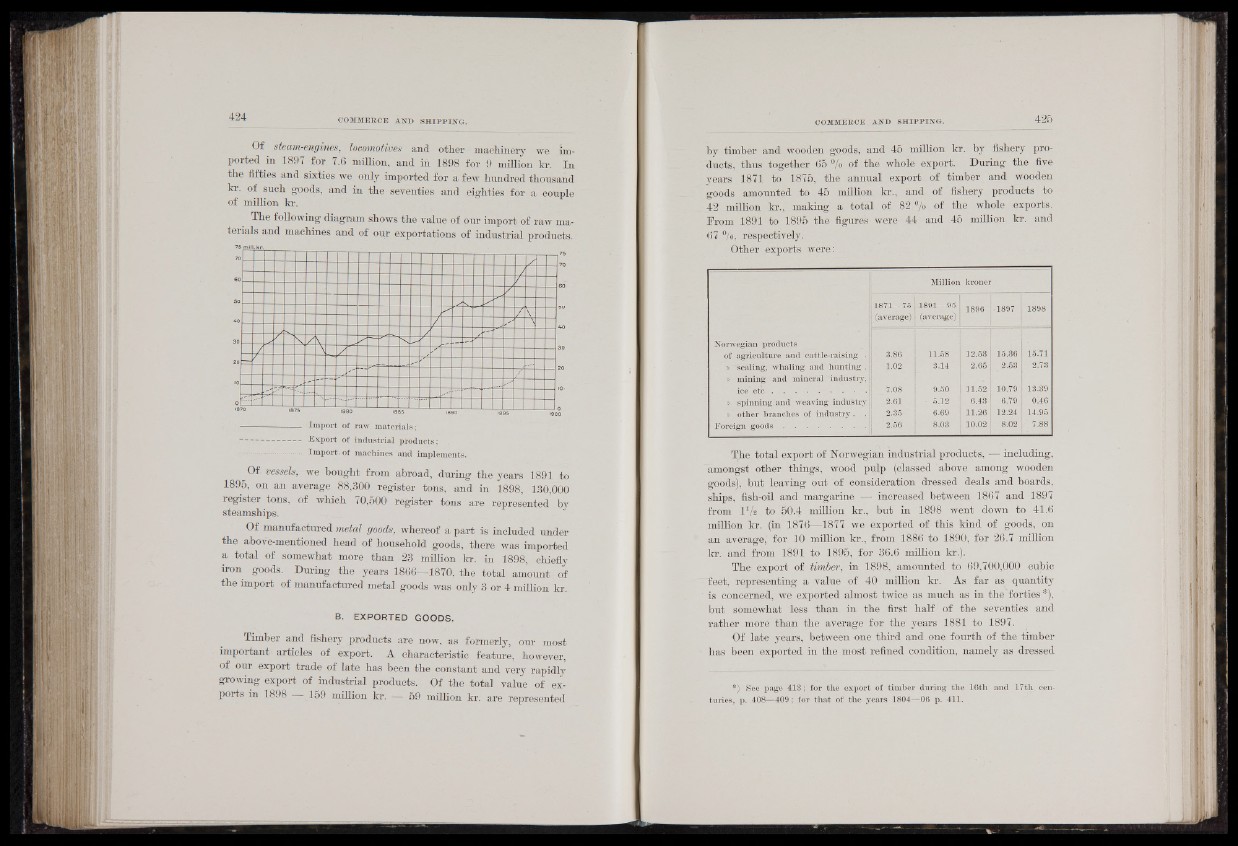
Of steam-engines, locomotives and oilier uiiicli i nory we imported
in 1897 for 7.6 million, and in 1898 for 9 million kr. In
the fifties and sixties we only imported for a few hundred thousand
kr. of such goods, and in the seventies and eighties for a couple
of million kr.
The following diagram shows the value of our import of raw materials
and machines and of our exportations of industrial products.
7 5 mill k r.
/ |
7 ■
If _ / V _
/ '" 1 |
\ g \ /
1 / — /
— § n
- -
.......I
70 >8
1
75 18 ÎO
f i r f t ■ft
--------- . Import of raw materials;
---------------------Export of industrial products;
...................... Import, of machines and implements.
Of vessels, we bought from abroad, during the years 1891 to
1895, on an average 88,300 register tons, and in 1898, 130,000
register tons, of which 10.500 register tons are represented by
steamships.
Of manufactured metal goods, whereof a part is included under
the above-mentioned head of household goods, there was imported
a total of somewhat more than 23 million kr. in 1898, chiefly
iron goods. During the years 1866—1870, the total amount of
the import of manufactured metal goods was only 3 or 4 million kr.
B. EXPORTED GOODS.
Timber and fishery products are now, as formerly, our most
important articles of export. A characteristic feature, however,
of our export trade of late has been the constant and very rapidly
growing export of industrial products. Of the total value of exports
in 1898 -g| 159 million kr. — 59 million kr. are represented
by timber and wooden goods, and 45 million kr. by fishery products,
thus together 65 % of the whole export. During the five
years 1871 to 1875, the annual export of timber and wooden
goods amounted to 45 million kr., and of fishery products to
42 million kr., m a k i n g a total of 82% of the whole exports.
From 1891 to 1895 the figures were 44 and 45 million kr. and
67 °/o, respectively.
Other exports were: _
Million kroner
1871—75 1891—95. 1896 •1897 1898
1 (average) (average)
Norwegian products
of agriculture and cattle-raising 3.86 11.58 12.53 t|i5.36 15.71
i> "sealing, whaling and hunting ||j | 1.02 3.14 2.65 2.53 2.73
» mining and mineral in d u stry b r:
ice etc . . . . . . ^-08 9.50 11.52 10.79 13.39
» spinning, and weaving industry 2.61. • 5,12 6.43 6.79 0!46
a other branches of industry . ||] I 2.35 6.69 11.26 12.24 14.95
Foreign g o o d s ..................................... 2.56 8.03 10.02 8.02 7.88
The total export of Norwegian industrial products, — including,
amongst other things, wood pulp (classed above among wooden
goods), but leaving out of consideration dressed deals and boards,
ships, fish-oil and margarine^H increased between 1867 and 1897
from IVs to 50.4 million kr., but in 1898 went down to 41.6
million kr. (in 1876—1877 we exported of this kind of goods, on
an average,' for 10 million kr., from 1886 to 1890, for 26.7 million
kr. and from 1891 to 1895, for 36.6 million kr.).
The export of timber, in 1898, amounted to 69,700,000 cubic
'feet, representing a value of 40 million kr. As far as quantity
is concerned, we exported almost twice as much as in the forties *),
but somewhat less than in the first half of the seventies and
rather more than the average for the years 1881 to 1897.
Of late years, between one third and one fourth of the timber
has been exported in the most refined condition, namely as dressed
•) See page 413 ; for thé export of timber during the 16th and 17th centuries,
p. 408—409; for th a t of the years 1804—06 p. 411.