CH A P T E R V
TH E SYSTEM OF SCHEMATIC DIAGRAMS AND ITS RESULTS
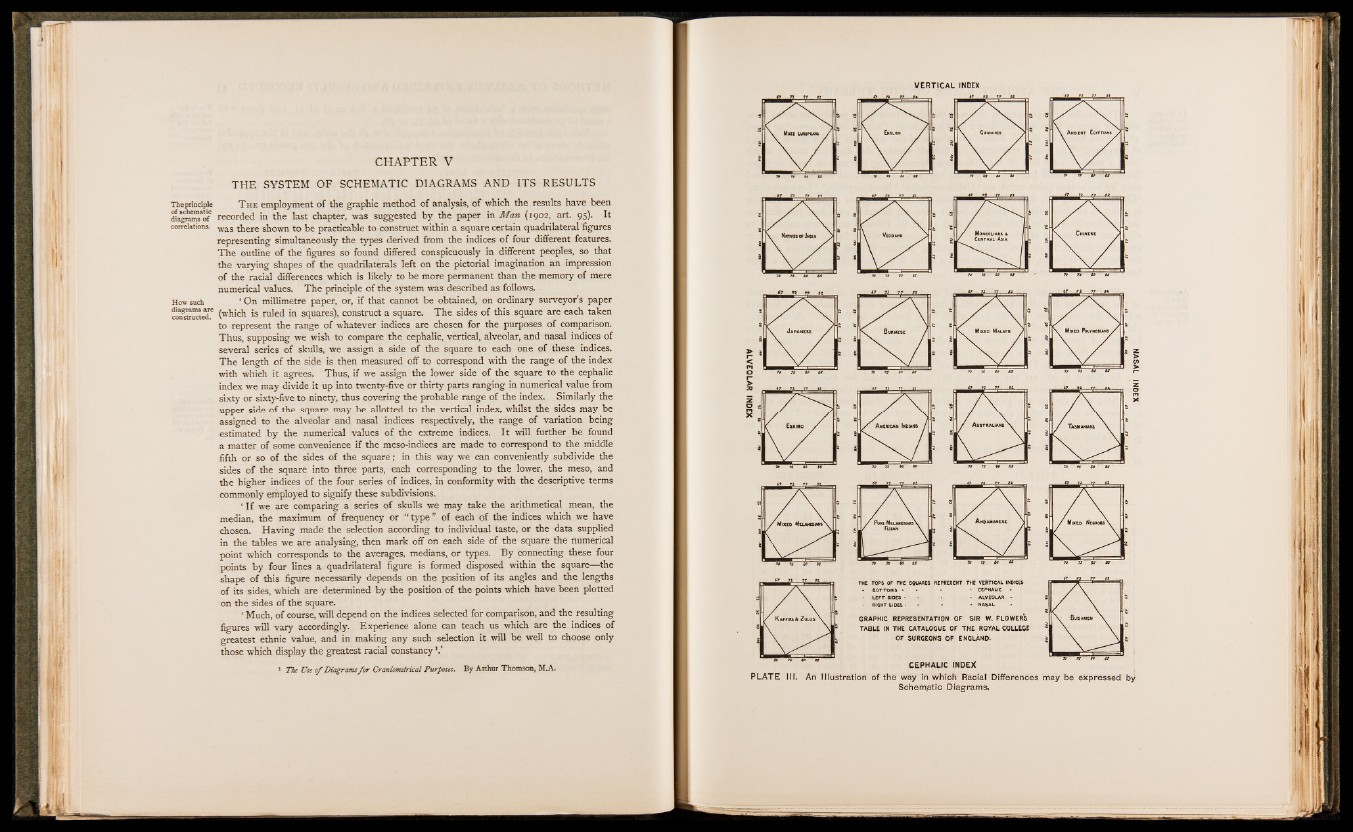
The principle T h e employment of the graphic method of analysis, of which the results have been
diagrams o f recorded in the last chapter, was suggested by the paper in Man (1902, art. 95). It
correlations, there shown to be practicable to construct within a square certain quadrilateral figures
representing simultaneously the types derived from the indices of four different features.
The outline of the figures so found differed conspicuously in different peoples, so that
the varying shapes of the quadrilaterals left on the pictorial imagination an impression
of the racial differences which is likely to be more permanent than the memory of mere
numerical values. The principle of the system was described as follows.
How such ‘ On millimetre paper, or, if that cannot be obtained, on ordinary surveyor’s paper
cdnESted.6 (which is ruled in squares), construct a square. The sides of this square are each taken
to represent the range of whatever indices are chosen for the purposes of comparison.
Thus, supposing we wish to compare the cephalic, vertical, alveolar, and nasal indices of
several series of skulls, we assign a side of the square to each one of these indices.
The length of the side is then measured off to correspond with the range of the index
with which it agrees. Thus, if we assign the lower side of the square to the cephalic
index we may divide it up into twenty-five or thirty parts ranging in numerical value from
sixty or sixty-five to ninety, thus covering the probable range of the index. Similarly the
upper side of the square may be allotted to the vertical index, whilst the sides may be
assigned to the alveolar and nasal indices respectively, the range of variation being
estimated by the numerical values of the extreme indices. It will further be found
a matter of some convenience if the meso-indices are made to correspond to the middle
fifth or so of the sides of the square; in this way we can conveniently subdivide the
sides of the square into three parts, each corresponding to the lower, the meso, and
the higher indices of the four series of indices, in conformity with the descriptive terms
commonly employed to signify these subdivisions.
* I f we are comparing a series of skulls we may take the arithmetical mean, the
median, the maximum of frequency or “ type” of each of the indices which we have
chosen. Having made the selection according to individual taste, or the data supplied
in the tables we are analysing, then mark off on each side of the square the numerical
point which corresponds to the averages, medians, or types. By connecting these four
points by four lines a quadrilateral figure is formed disposed within the square— the
shape of this figure necessarily depends on the position of its angles and the lengths
of its sides, which are determined by the position of the points which have been plotted
on the sides of the square.
‘ Much, of course, will depend on the indices selected for comparison, and the resulting
figures will vary accordingly. Experience alone can teach us which are the indices of
greatest ethnic value, and in making any such selection it will be well to choose only
those which display the greatest racial constancy V
1 The Use o f D ia gram s fo r C ran iom elrica l P u rposes. B y Arthur Thomson, M .A.
ALVEOLAR INDEX
Schematic Diagrams.
NASAL INDEX